
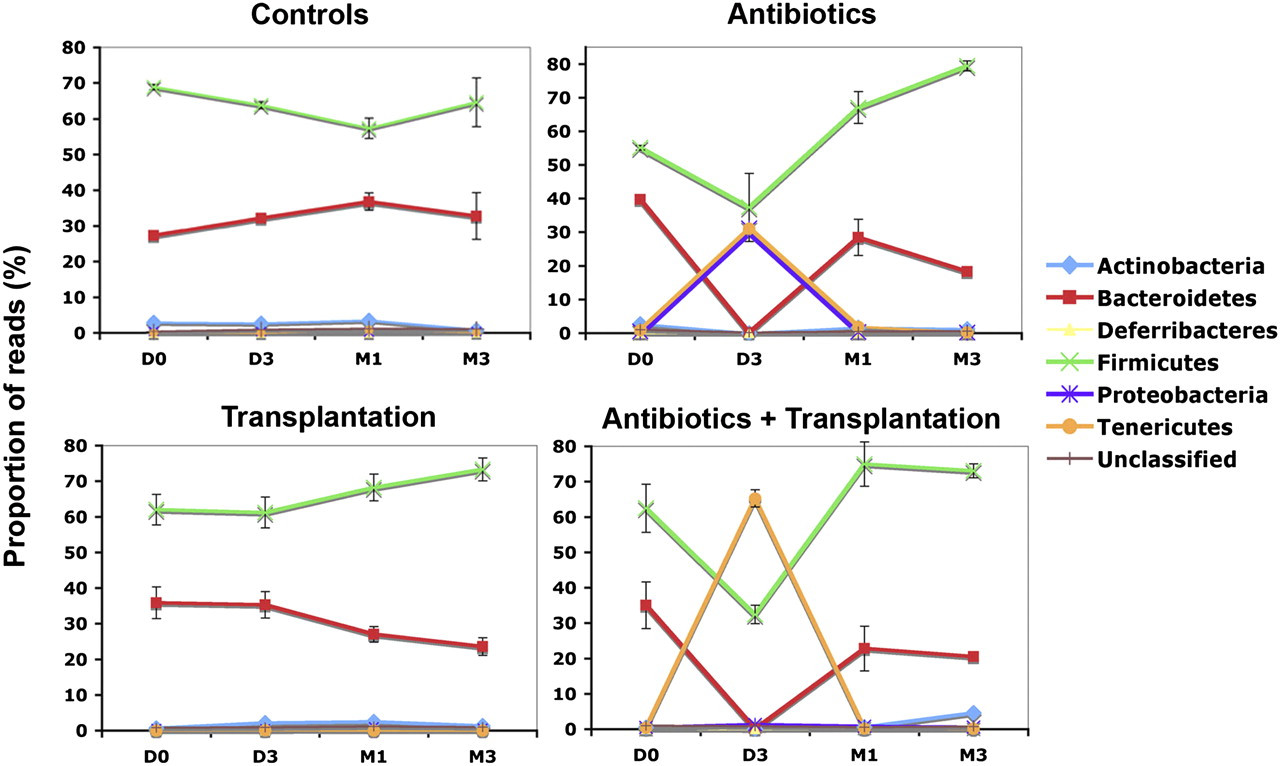
Figure 4.
Variation of the diversity of the microbial communities. Phylotypes were assigned a taxonomy using the RDP classifier at the phylum level and at different time points. Mean value (n = 3 for controls and ATB; n = 4 for Transplanted and ATB+Transplanted) ±SD are plotted.


