
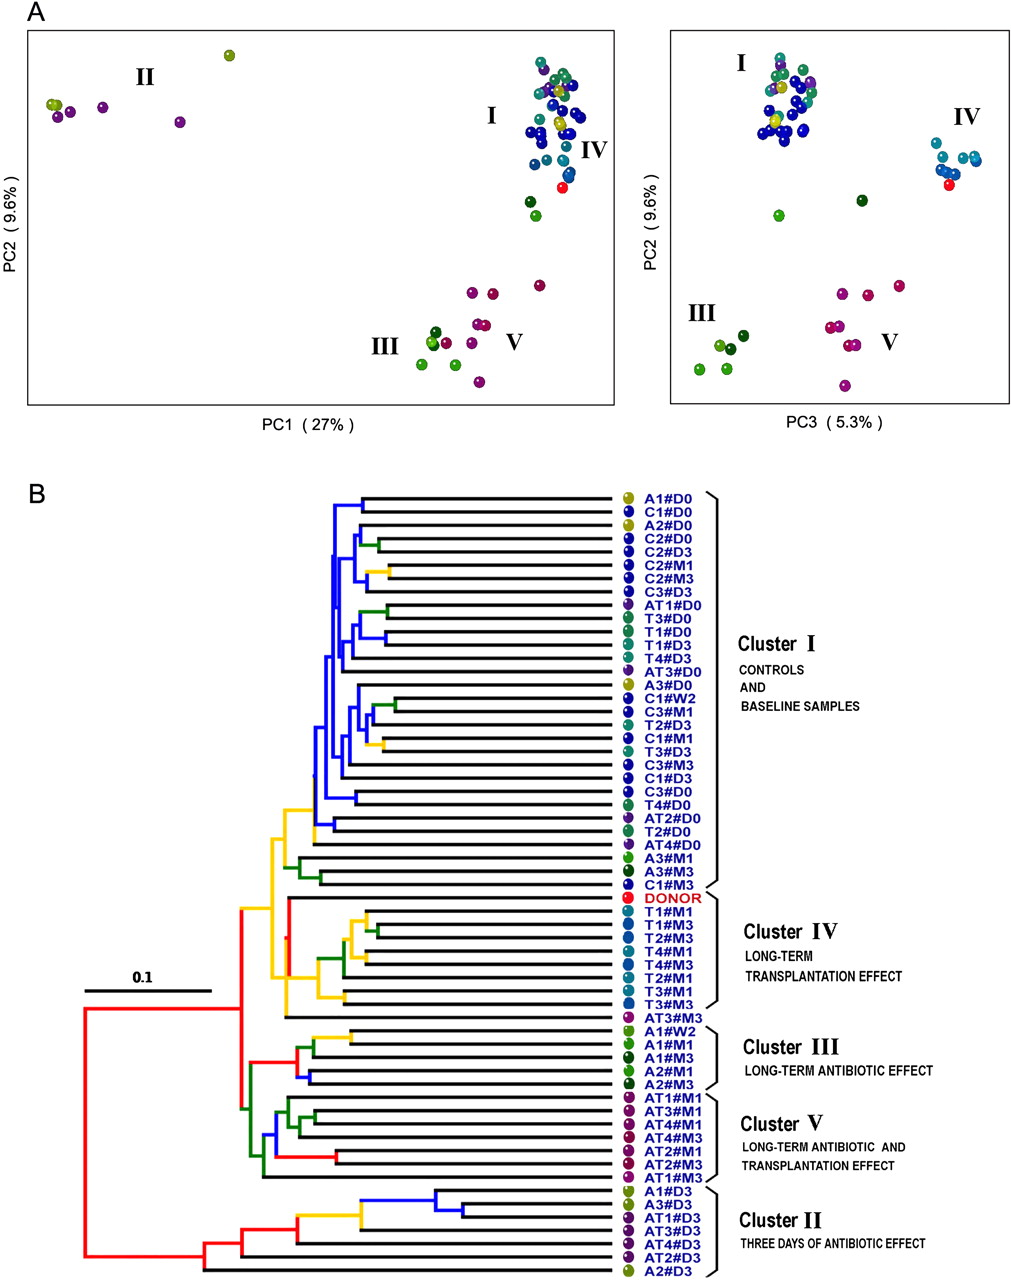
16S gene surveys show clustering of bacterial communities by treatments. (A) Principal coordinates analysis (PCoA) performed on pairwise unweighted UniFrac distances shows a 3-d antibiotic effect (PC1 and PC2) and a long-term effect for all treated groups (PC2 and PC3). (B) Hierarchical cluster tree built using UPGMA (unweighted pair group method with arithmetic mean) from the same UniFrac distance matrix that was used for the PCoA. Each dot represents a sample codified by either C (controls), A (ATB), T (Transplanted), or AT (ATB and Transplanted), followed by the number of the animals (from one to three or to four) in each group and by a date of sample collection (#D0, #D3, #W2 [week 2], #M1, and #M3). The effect of each treatment leads to five clusters of samples (I to V). Branches in the UPGMA tree are colored according to their jackknife support: red, 75%–100%; yellow, 50%–75%; green, 25%–50%; blue, <25% support.


