
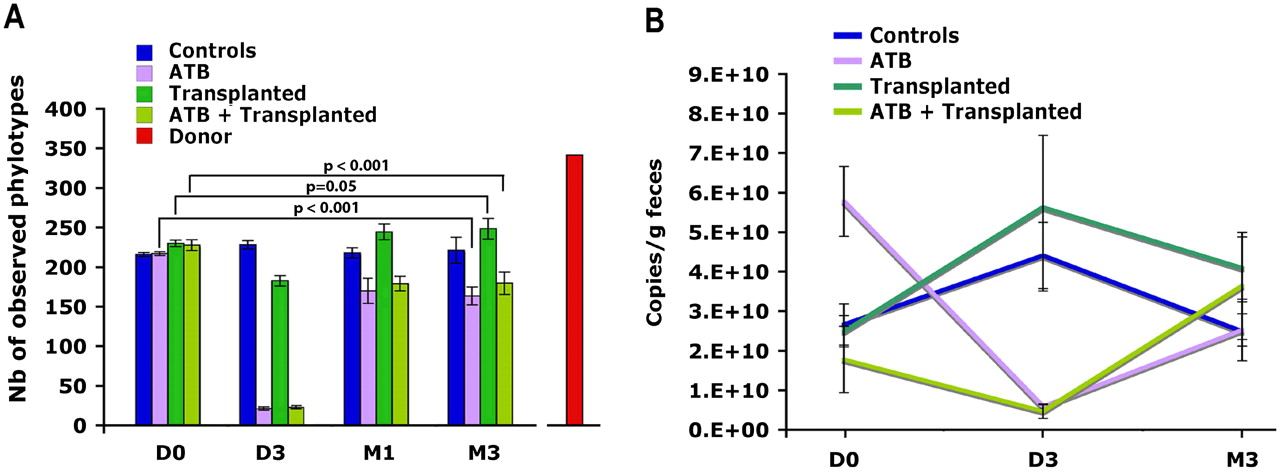
Figure 2.
Variation of bacterial load and richness. (A) Number of observed phylotypes as defined at 97% sequence identity. For both figures, mean value (n = 3 for controls and ATB; n = 4 for Transplanted and ATB + Transplanted) ±SD are plotted. (B) Bacterial quantification assessed by real-time PCR of the 16S gene at three time points: baseline (D0), day 3 (D3), and month 3 (M3).


