
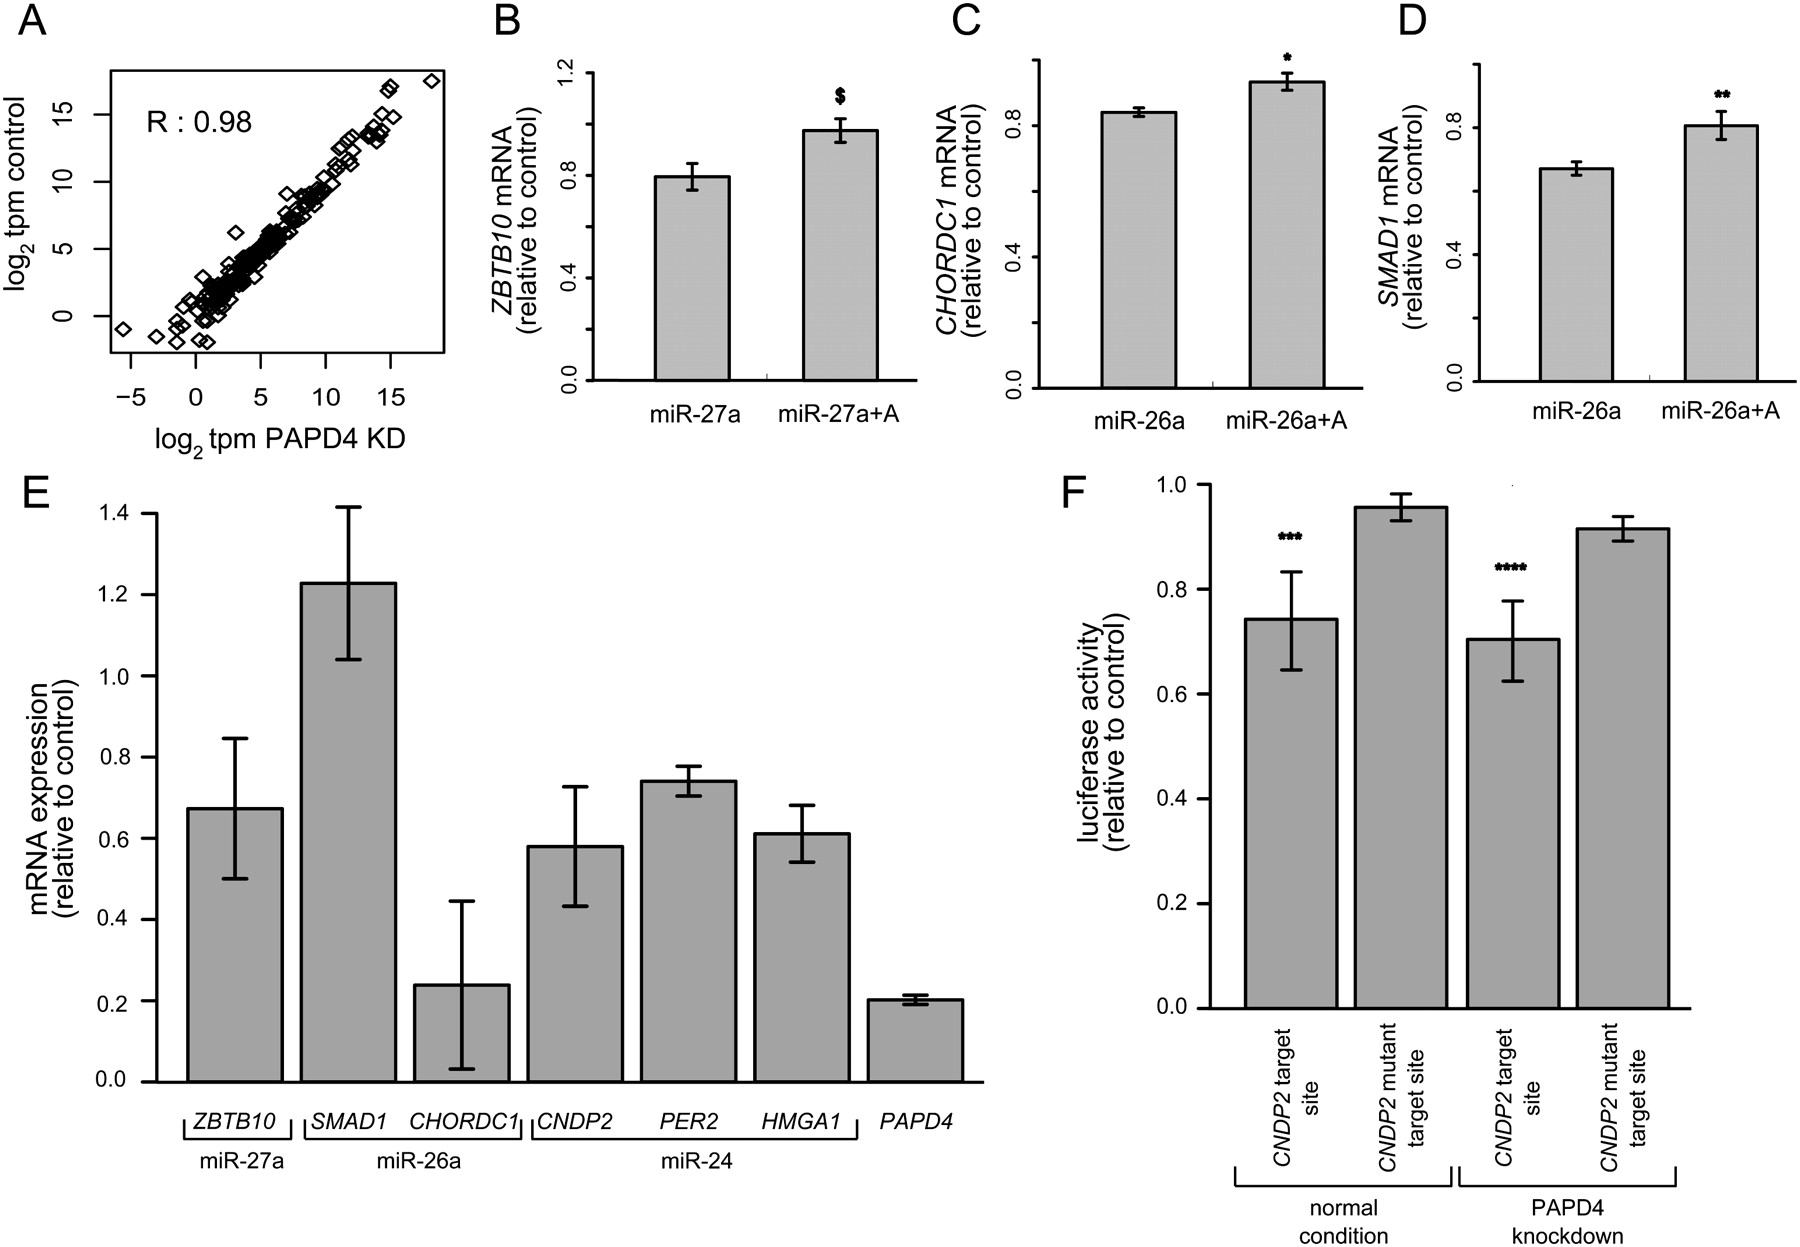
miRNA expression levels are unaffected by PAPD4 knockdown and 3′ miRNA adenine addition reduces mRNA target repression. (A) Total sequence tag counts mapping to all miRNA loci compared across the control and PAPD4 knockdown short RNA libraries. Tag counts are normalized into tags per million (tpm) and log2-transformed. Pearson's correlation is given in the upper left corner of the plot. (B–D) Targets of miRNA (B, ZBTB10; C, CHORDC1; D, SMAD1) are repressed after transfection of primary miRNA sequence (left) and repression is reduced after transfection of miRNA with 3′ adenine addition (right). Expression ratio is normalized to the endogenous GAPDH mRNA level, with average values bracketed by SEM error bars (Methods). While ZBT10 expression appears to be reduced, the change is not significant at a threshold P < 0.05. $P = 0.065 for miR-27a targeting of ZBTB10, *P = 0.030 for miR-26a targeting of CHORDC1, and **P = 0.028 for miR-26a targeting of SMAD1 (paired Students t-test, n = 3). (E) Expression levels of mRNA targets of different miRNA are generally decreased after knockdown of PAPD4. Each bar represents a distinct mRNA target, labeled on the x-axis along with the known miRNA that targets that gene. Expression ratio is normalized as in B–D, with n = 4. The expression level of PAPD4 during knockdown is provided as a reference in the far right bar of the plot. (F) Luciferase activity of reporter assay for wild-type and mutated miRNA target sequence of CNDP2 mRNA transcript. Luciferase activity is measured as described in Methods and tested in normal and PAPD4 knockdown conditions. ***P = 0.035 in normal condition and ****P = 0.015 in PAPD4 knockdown condition (paired Students t-test, n = 4).


