
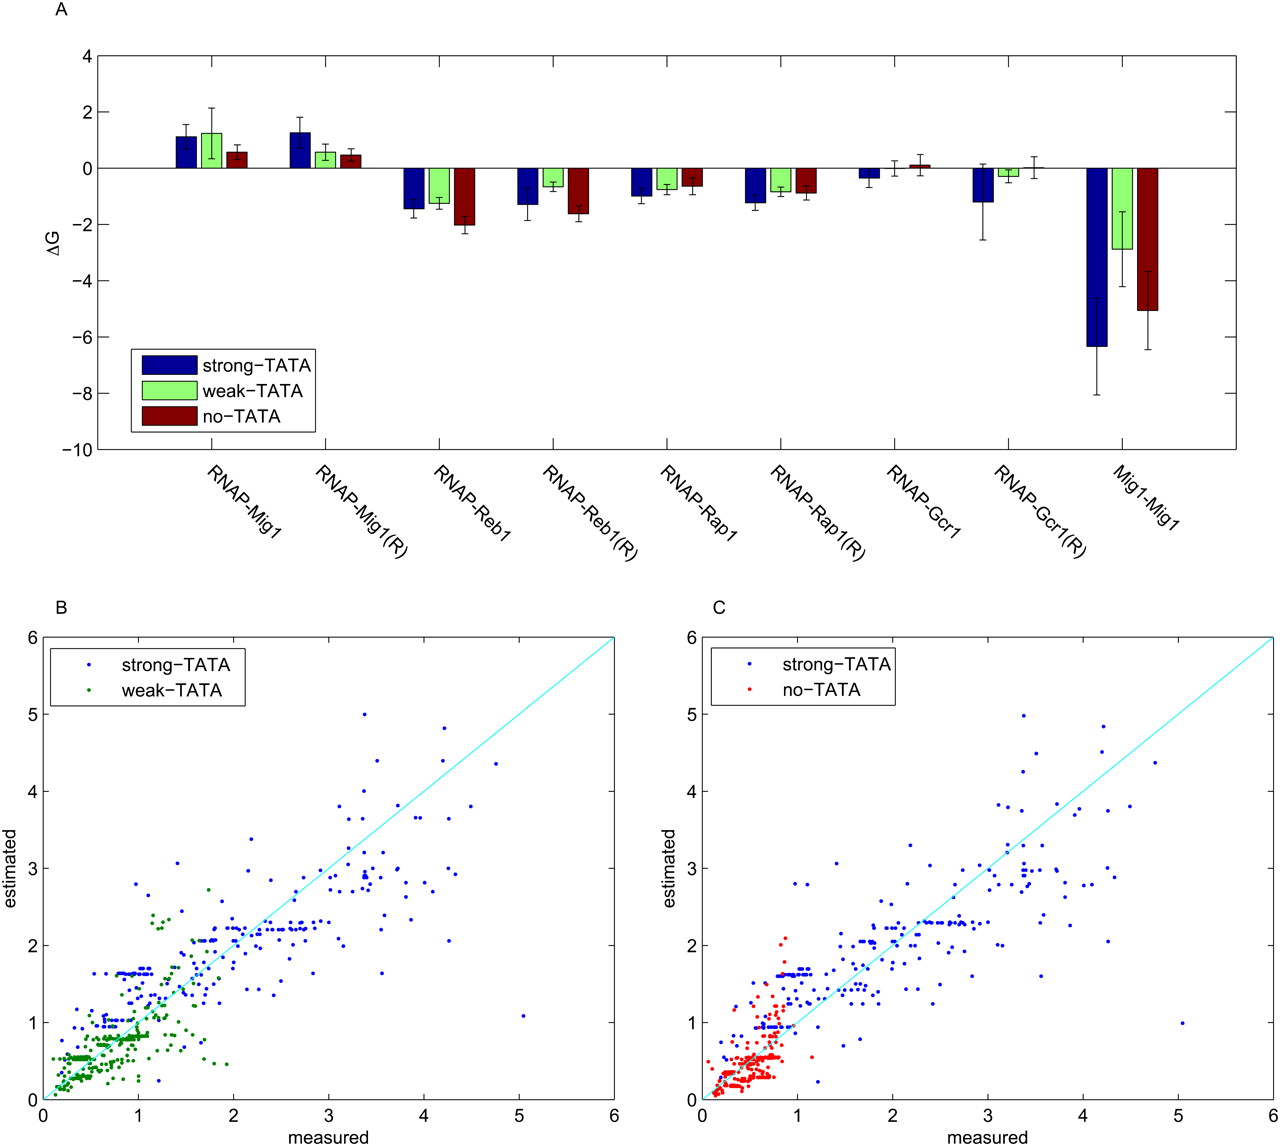
(A) Estimated ΔG for the interactions between TFs and RNAP. (R) Binding site in the reverse orientation. Each library was fit individually with the thermodynamic model. The figure shows the value of the estimated ΔG for TF–RNAP and TF–TF interactions with a 95% confidence interval (only the significant parameters are shown here); there are no significant differences in the energies of the interactions between RNAP and TF and in TF cooperativity in the three libraries. (B,C) Scatter plots of the pooled libraries. Each dot represents a library clone, with its measured expression on the x-axis, and its estimated expression on the y-axis (using the thermodynamic model). (Blue dots) Clones in the strong-TATA library; (green dots) clones in the weak-TATA library; (red dots) clones in the no-TATA library. (Cyan line) The perfect model, in which estimated values are exactly equal to the measured values.


