
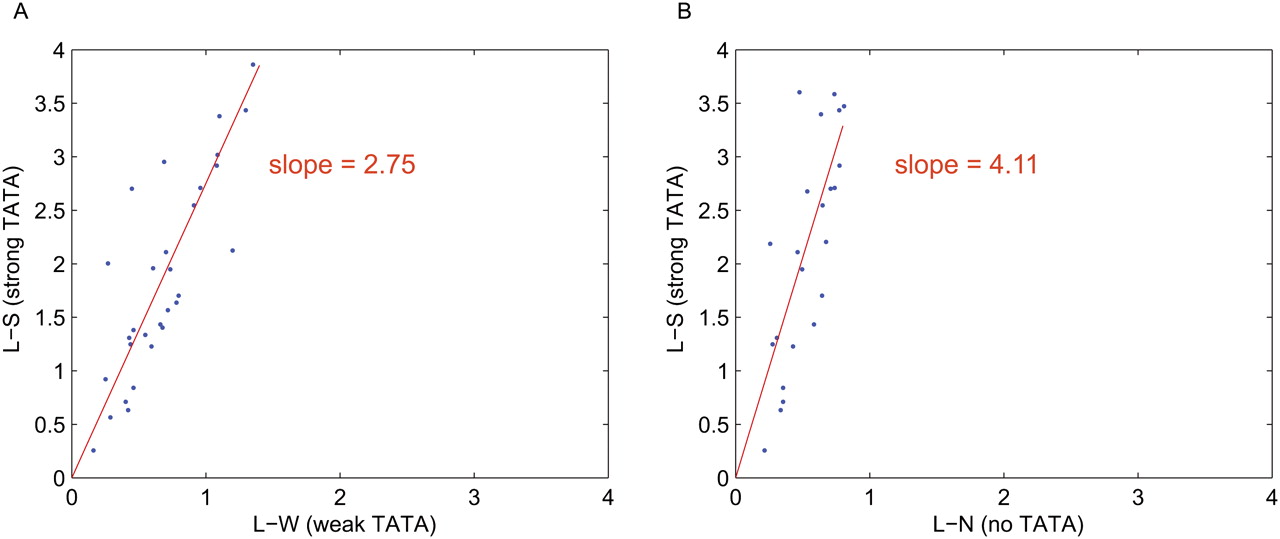
Figure 2.
Comparison of the expression of identical library clones. (A) Scatter plot of identical clones between the L-S and L-W libraries. The slope of the best-fit regression line is 2.75. (B) Scatter plot of identical clones between the L-S and L-N libraries. The slope of the best-fit regression line is 4.11. The Pearson correlation is 0.82 for identical clones between L-S and L-W and between L-S and L-N.


