
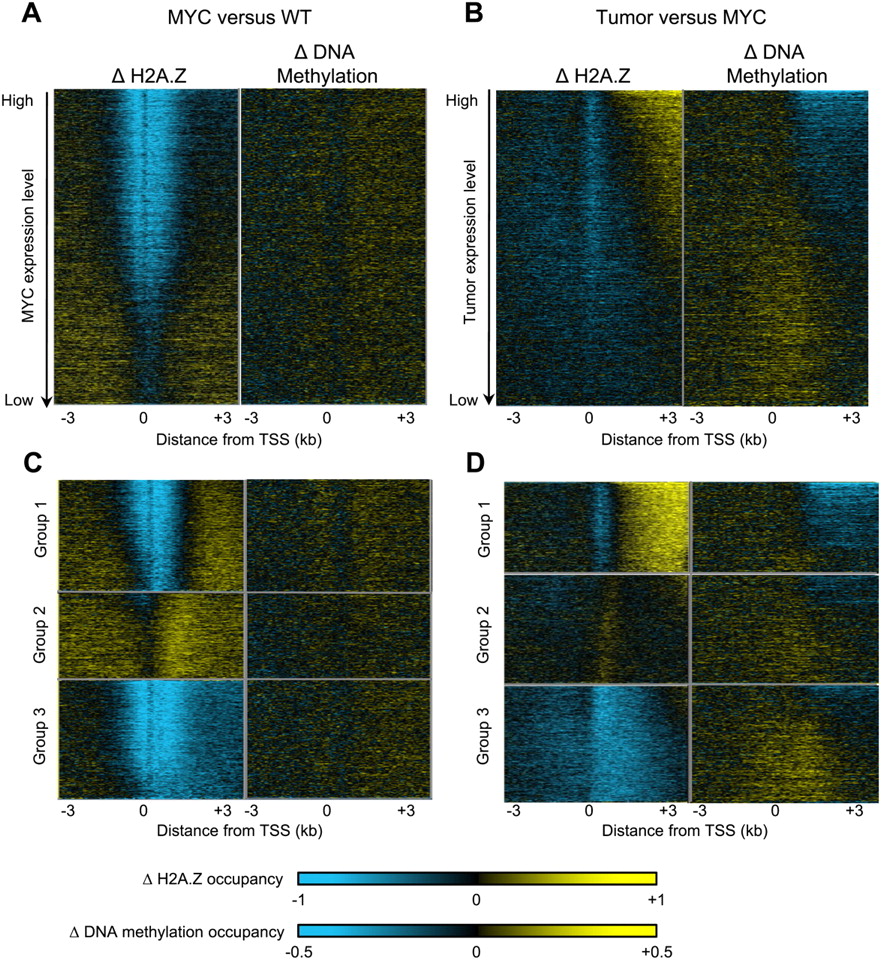
Figure 6.
Changes in H2A.Z and DNA methylation in the transition from overproliferation to tumor. Changes in H2A.Z and DNA methylation were compared as heat maps for MYC versus WT (A,C) and tumor versus MYC (B,D). (A,B) Genes were aligned at their TSSs and ranked by decreasing expression level. Data are represented as heat maps: (yellow) an enrichment of ChIP or MeDIP over input signals, (blue) depletion. (C,D) Genes were sorted into three groups using k-means clustering by weighting bins from the TSS to +3 kb downstream only in the H2A.Z sample. Each gene is in the same horizontal position for H2A.Z and DNA methylation.


