
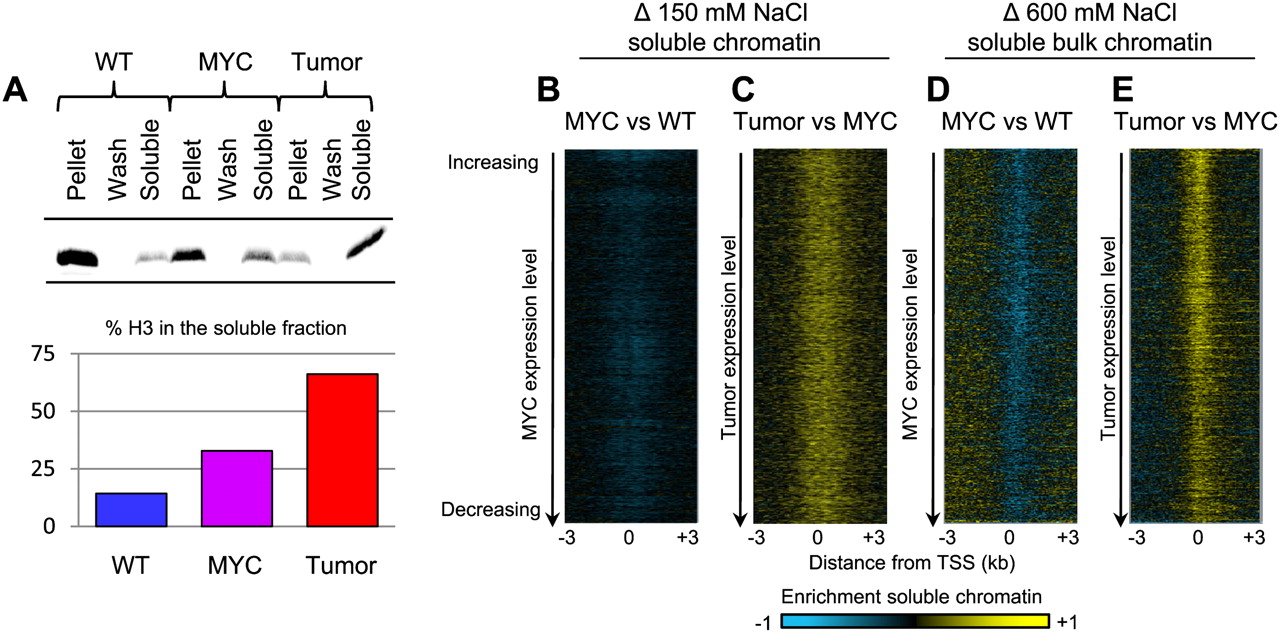
Chromatin solubility increases during oncogenesis. (A) Western blot of histones from chromatin fractions probed with an anti-H3 antibody. The fraction of H3 in the soluble input material is represented as a percentage of total histone H3 for each cell type (average of two samples for each cell type). (B,C) The ratio of 150 mM salt-soluble input chromatin between cell types displayed as heat maps. We obtained similar results by profiling individual 150 mM salt fractions versus MNased nuclei (Supplemental Fig. S6). (D,E) Changes in 600 mM salt-soluble chromatin between cell types displayed as heat maps: (yellow) an enrichment of soluble chromatin, (blue) depletion of soluble chromatin. Heat maps are ordered by decreasing gene expression levels in the MYC (B,D) or tumor (C,E) cells.


