
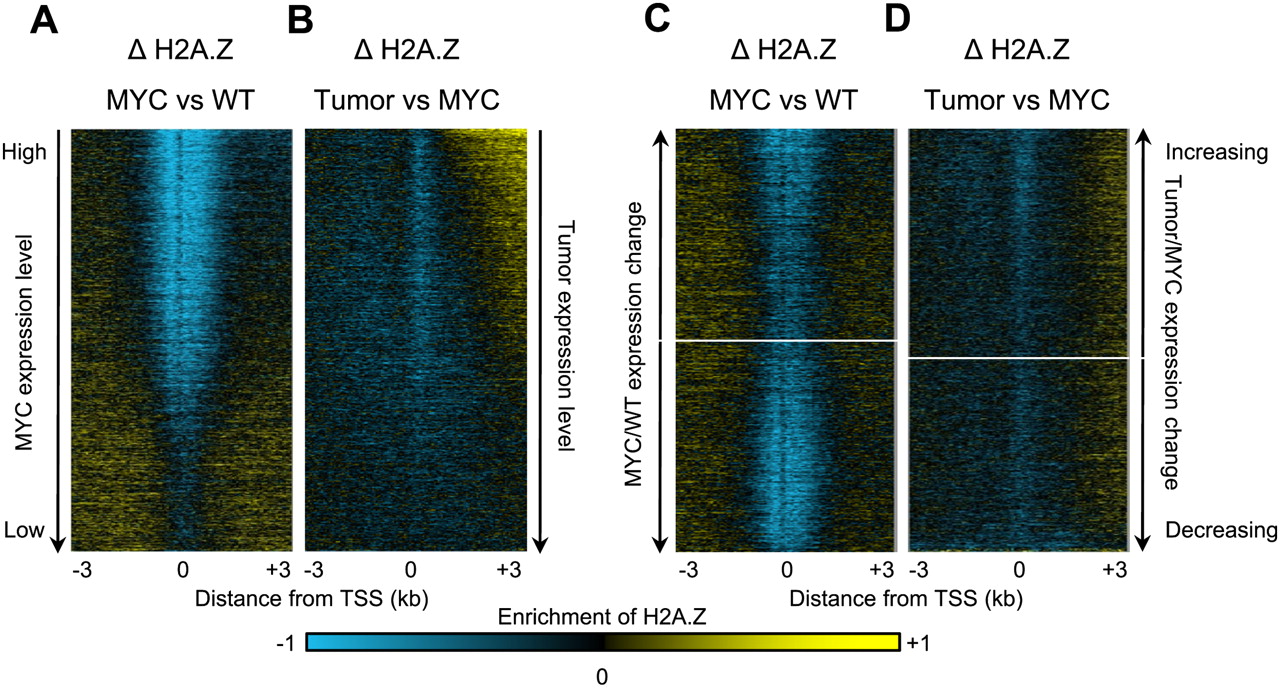
Redistribution of H2A.Z from TSSs to gene bodies. (A) Changes in H2A.Z occupancy from wild-type (WT) to MYC-induced pre-B cells. (B) Changes in H2A.Z occupancy from MYC-induced pre-B to lymphoma cells. Heat maps were ordered by decreasing gene expression levels in the MYC (A) or lymphoma (B) cells. (C,D) Changes in H2A.Z occupancy from WT to MYC pre-B cells (C) and from MYC to lymphoma (D). Genes were ordered by the change in expression between cell types. Standard deviate normalized probe signals are represented as heat maps: (yellow) an enrichment of ChIP over input signal for H2A.Z, (blue) depletion. The genes with the largest gains in expression in the tumor are at the top, and the genes with the largest drops in expression level are at the bottom.


