
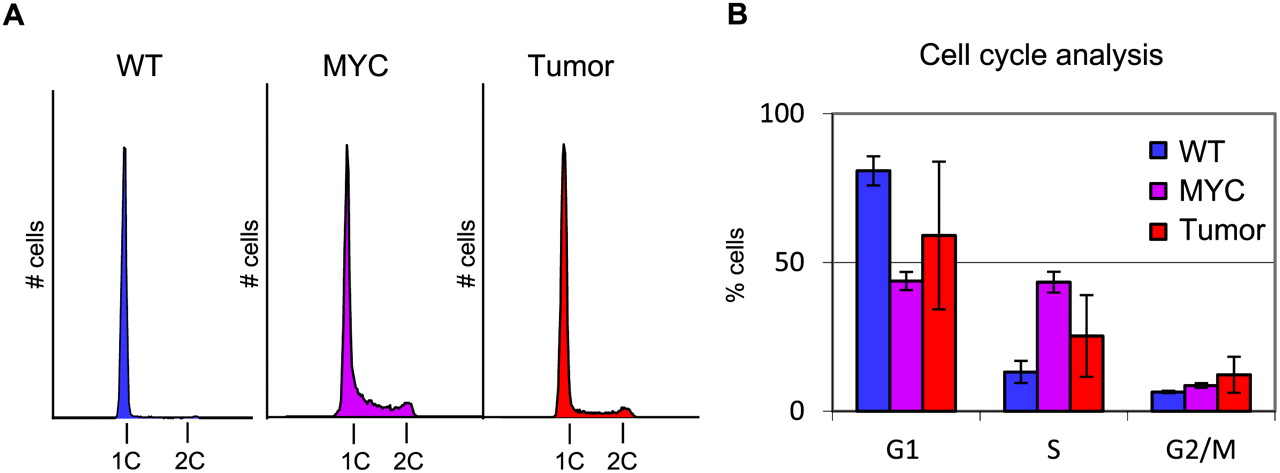
Figure 2.
Cell cycle analysis of DNA content during cell state changes. (A) Examples of FACS plots. (B) Five samples of each cell type were analyzed and averaged. DAPI staining was used for cell sorting.
(Downloading may take up to 30 seconds. If the slide opens in your browser, select File -> Save As to save it.)
Click on image to view larger version.
Cell cycle analysis of DNA content during cell state changes. (A) Examples of FACS plots. (B) Five samples of each cell type were analyzed and averaged. DAPI staining was used for cell sorting.
 CiteULike
 Delicious
 Digg
Digg Facebook
 Google+
 Reddit
 Twitter
