
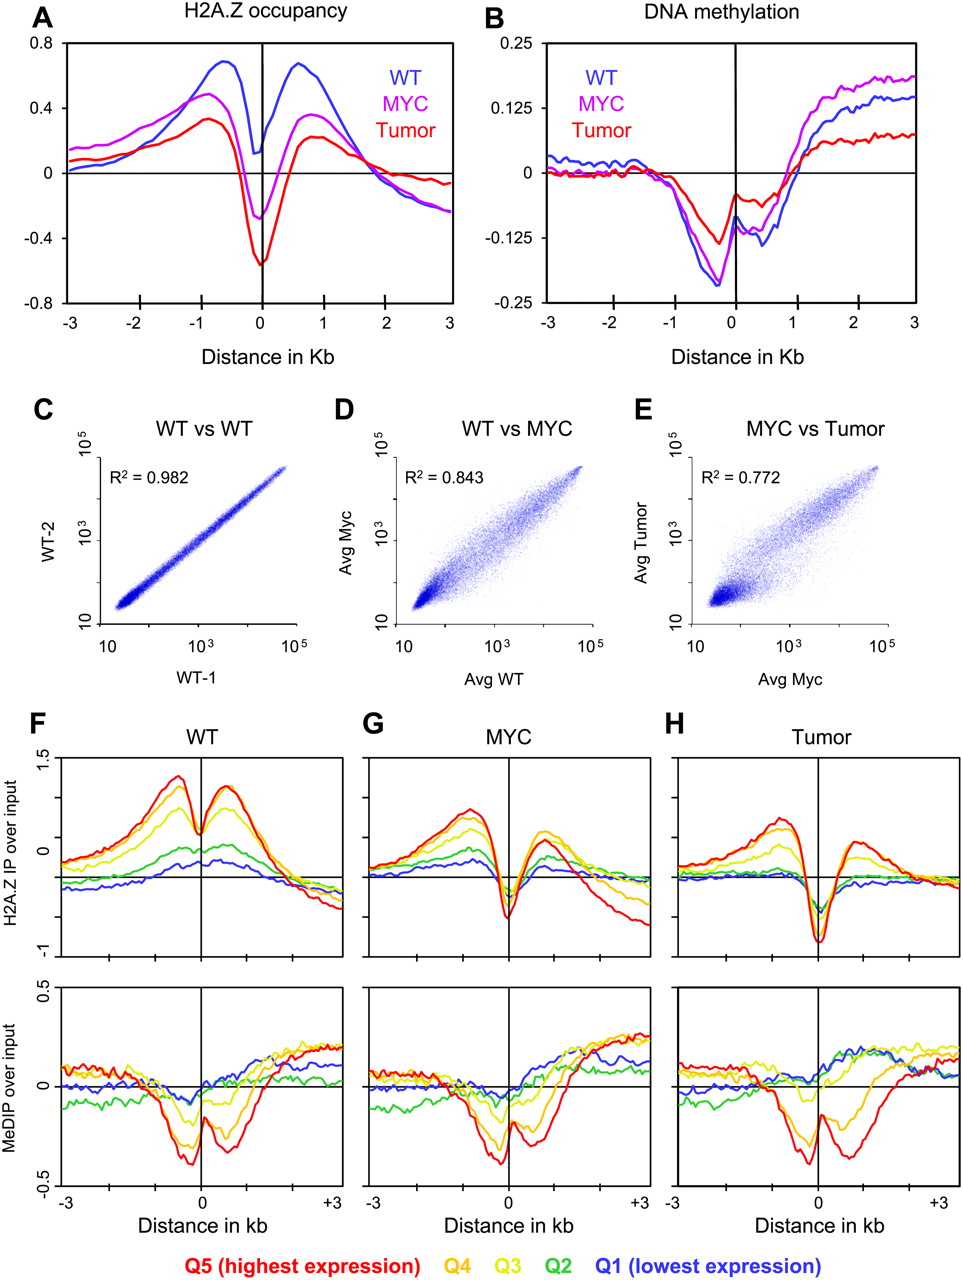
Figure 1.
H2A.Z and DNA methylation occupancy around TSSs. Genes were aligned at the TSS and the normalized probe signals were averaged in 50-bp bins for H2A.Z occupancy (A) and DNA methylation (B). (C–E) Comparisons of microarray expression data for each cell type. (F–H) Genes are aligned at the TSS and divided into quintiles (Q1–Q5) by decreasing expression level. The ChIP with microarray hybridization (ChIP-chip) data were normalized by computing standard deviates for each probe.


