
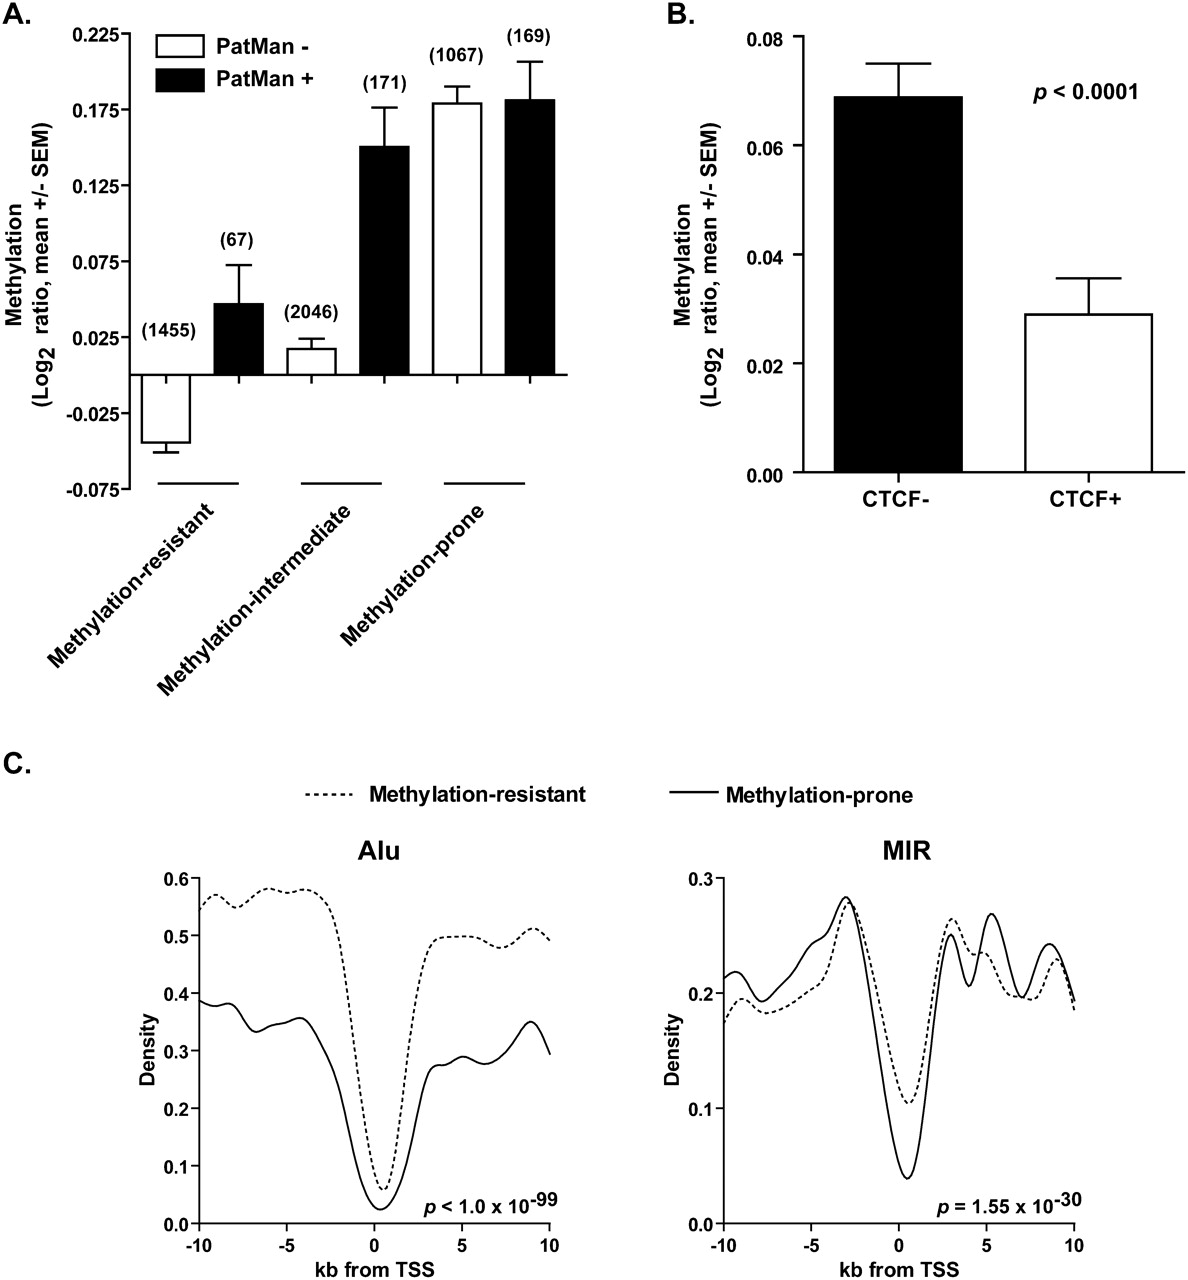
Other genomic features associated with methylation predisposition in cancer. (A) Performance of PatMan and retrotransposon marking in predicting promoter CpG methylation status in cancer. PatMan−, predicted methylation-resistant genes; PatMan+, predicted methylation-prone genes. The number of genes per category is presented above each column. (B) Measured promoter CpG island methylation by MCAM of CTCF bound (CTCF+) and unbound (CTCF−) genes. A gene was considered bound by CTCF if ChIP-seq data from public databases show binding of this protein in the 2-kb region centered in the gene TSS. (C) Abundance of Alu and MIR retrotransposons in the 20-kb sequence window centered in the TSS of 740 methylation-prone and 5658 methylation-resistant genes. Note that the depletion of MIR retrotransposons is more significant in the −2-kb to +2-kb sequence window.


