
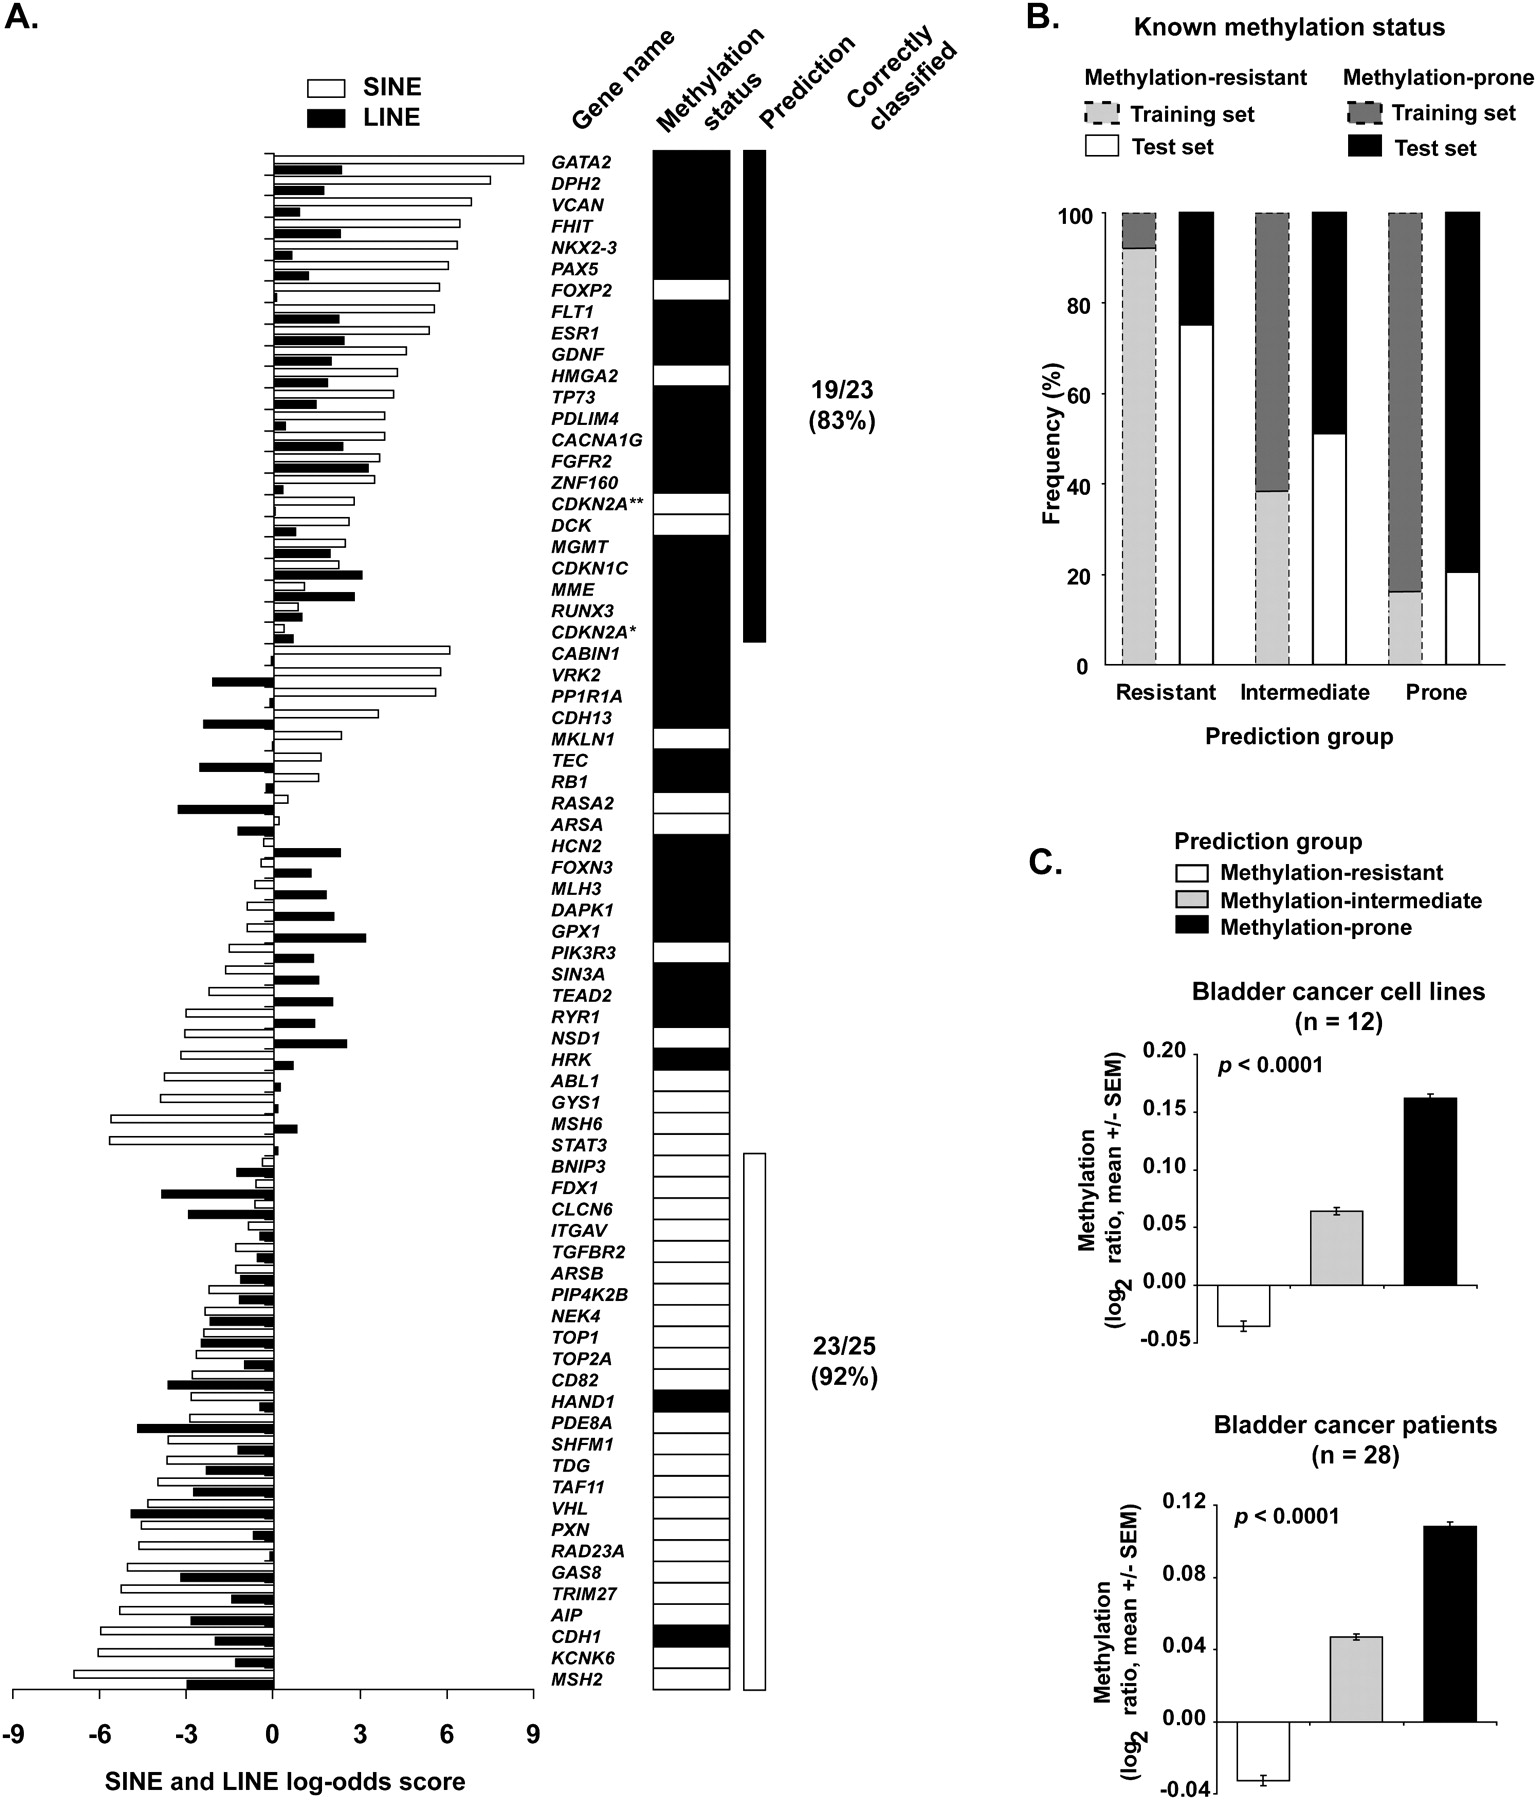
Prediction of gene predisposition and resistance to hypermethylation in cancer. (A) SINE and LINE scores of the training set genes. The scores were calculated according to the described log-odds ratio method for each gene and are represented as horizontal bars (white bars, SINE score; black bars, LINE score). Methylation status determined by bisulfite PCR methods is shown on the right. Genes with concordant depletion of SINE and LINE retrotransposons (log-odds ≥ 0) were predominantly methylation-prone, with the opposite found for genes with enrichment of both SINE and LINE repeats. Discordant SINE and LINE scores likely represent a class of genes with intermediate predisposition to methylation. *Transcript variant coding for the P16INK4A protein. **Transcript variant coding for the P14ARF protein. Black rectangles represent methylated genes; white rectangles represent unmethylated genes. (B) The predictive method based on SINE and LINE retrotransposons abundance was applied to a test set composed of 142 genes. The frequency of genes correctly classified according to their DNA methylation status in cancer was 79% for methylation-resistant and 75% for methylation-prone genes. These values were closely related to those found in the training set (gray bars). (C) Validation of the predictive method in a large set of cancer cell lines and primary cancer tissues. Methylation status of more than 6600 autosomal gene promoters was determined by MCAM. X chromosome genes were excluded from this analysis due to their hemimethylated status in female samples. The measured DNA methylation per tissue type was significantly higher in predicted methylation-prone genes than in predicted methylation-resistant and methylation-intermediate genes. Methylation is presented as the log2 ratio (cancer/control) of all oligonucleotide probes of a predicted methylation status.


