
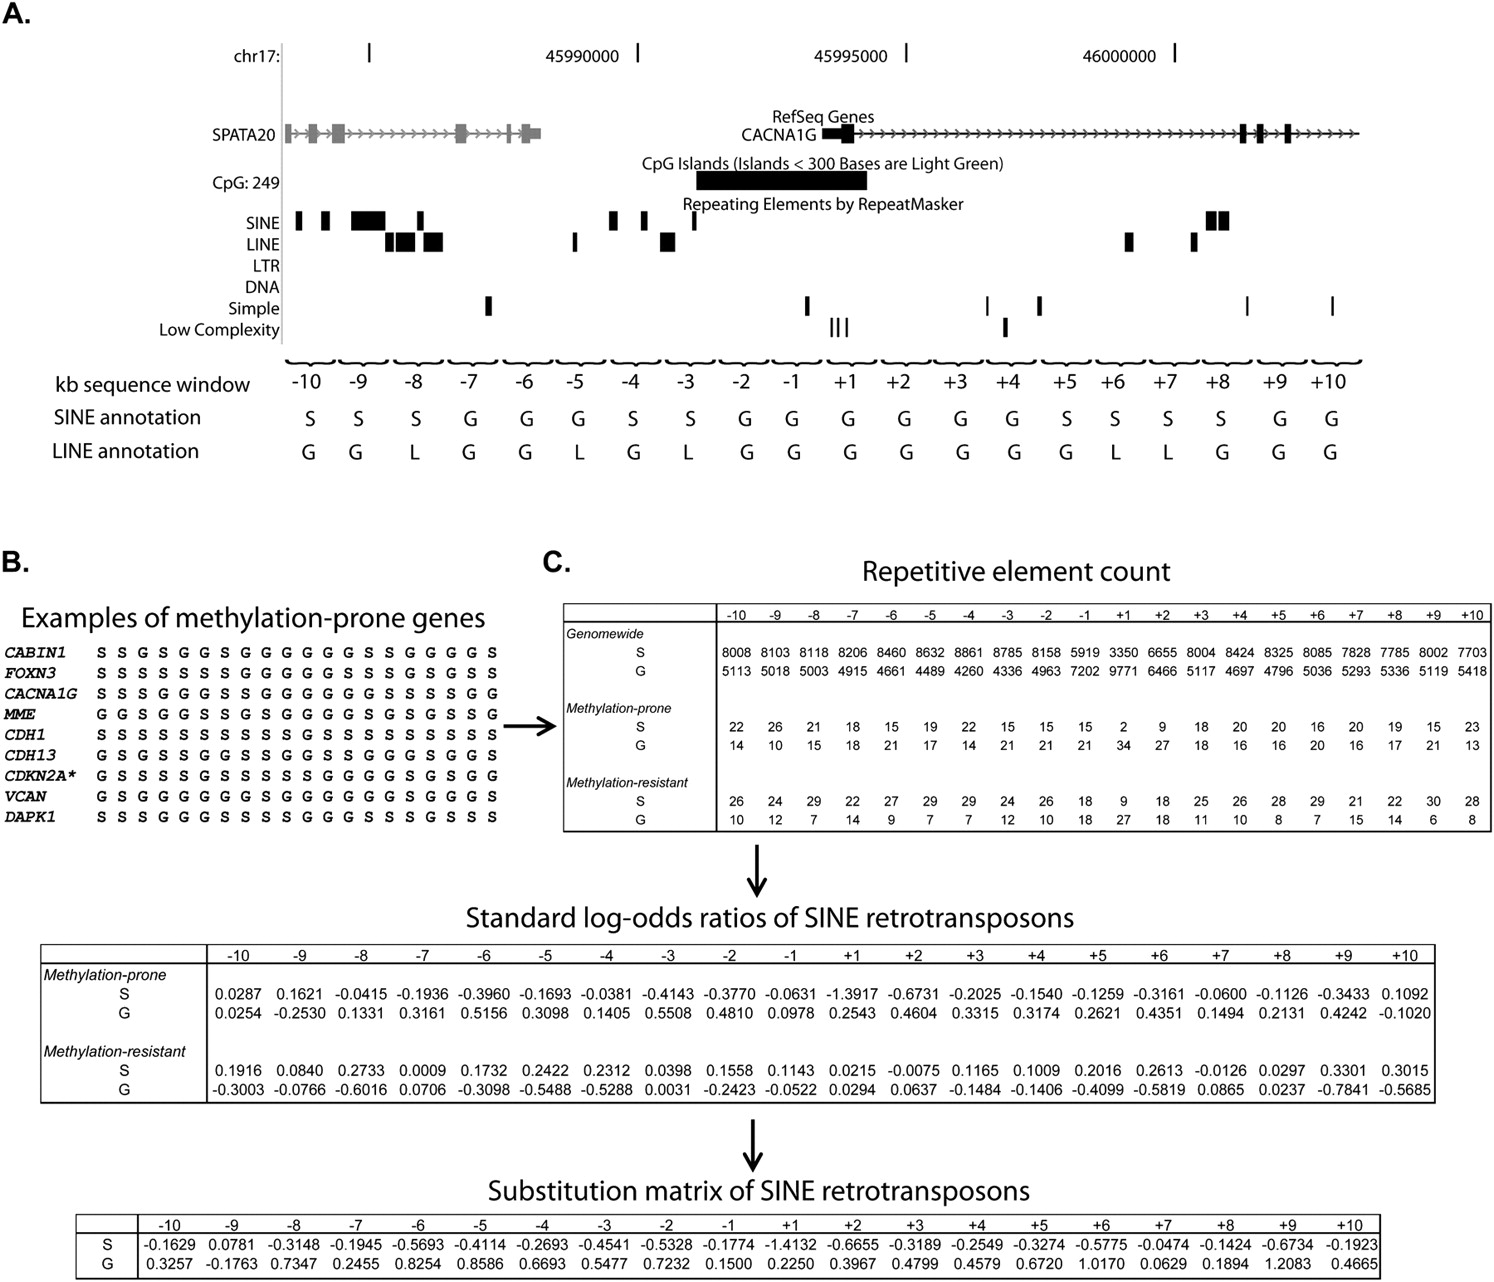
SINE and LINE abundance score to predict gene predisposition to methylation in cancer. (A) Annotation of SINE and LINE retrotransposons near the promoter sequence of a representative methylation-prone gene (in this example, the CACNA1G gene). The promoter sequence was divided into 20 bins of 1-kb sequence each (10 bins upstream and 10 bins downstream of each gene TSS), and the presence of SINE and LINE retrotransposons was annotated for each bin. Note that each element was annotated to just one bin (the closest to TSS). The same procedure was followed for all human genes with CpG islands overlapping or no more than 200 bp from their TSS. (B) Example of a 20-letter acronym representing SINE retrotransposon abundance in a collection of methylation-prone genes. (C) Counting of SINE presence (S) and absence (G) in all human genes with a promoter CpG island (genome-wide) and the training set of methylation-prone and methylation-resistant genes. SINE abundance was converted to standard log-odds ratios, as described in the Methods section, and the final substitution matrix for SINE retrotransposons is presented (bottom table). The same calculation was done for LINE retrotransposons. *Transcript variant coding for the P16INK4A protein.


