
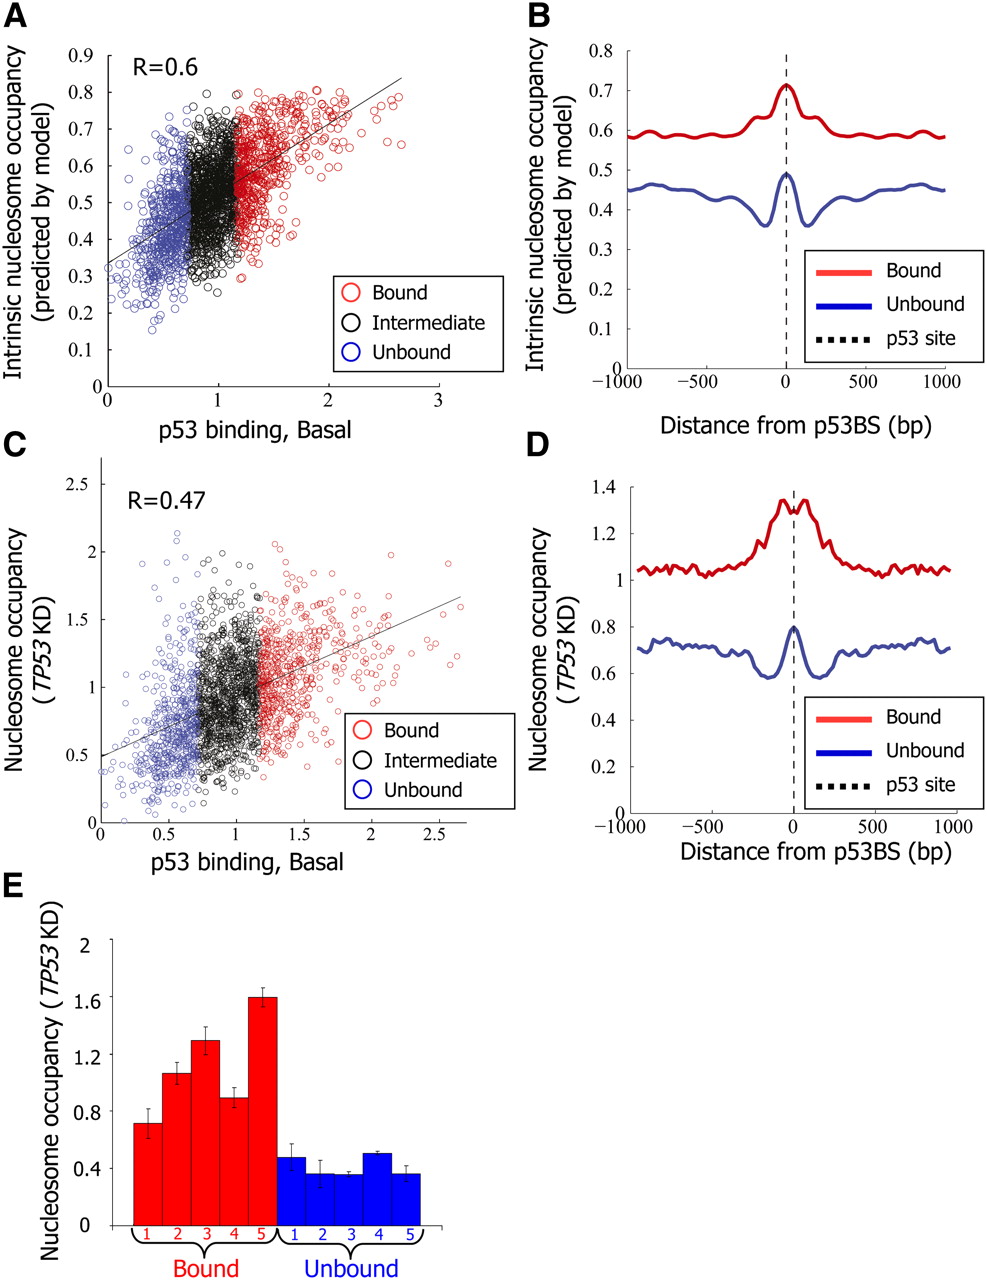
p53 binds preferentially regions with high intrinsic nucleosome occupancy. (A) For each of the putative p53-binding sites around which p53 binding was measured, shown is the log-ratio between p53 ChIP in nonstressed MCF7 cells and input-sonicated genomic DNA in the 500 bp surrounding the p53BS (p53 binding, Basal, x-axis; the same as in Fig. 1A), and the intrinsic nucleosome occupancy predicted by a model of nucleosome sequence preferences (Kaplan et al. 2009) (y-axis). Model predictions are shown as the average nucleosome occupancy per base pair across the 2000-bp region centered on each site. Sites are colored blue, black, or red, according to their classification from Figure 1A into unbound, intermediate-binding, or bound sites, respectively. The correlation between the nucleosome model predictions and measured p53 binding in the basal condition is indicated. (B) Model-predicted nucleosome occupancy per base pair, averaged across all p53-bound sites (red) and p53-unbound sites (blue), and shown along the 2000-bp region centered on each site. (C,D) Same as A and B, respectively, except that the y-axis corresponds to experimental measurements of nucleosome occupancy using the same tiling array as that used for measuring p53 binding in MCF7 cells with shRNA-mediated stable TP53 knockdown (TP53KD). Nucleosome measurements are shown as log-ratio between the nucleosome sample and sonicated genomic DNA. (E) Small-scale validation of the nucleosome occupancy measurements from C. Mononucleosomes were prepared from MCF7 cells with shRNA-mediated stable TP53 knockdown (TP53KD) by limited micrococcal nuclease digestion. Mononucleosomal DNA was subjected to quantification by qPCR for the five bound and five unbound sites listed in Supplemental Table 1, and values were normalized for qPCR readings of input-sonicated genomic DNA. Shown are the average and standard deviation (calculated from duplicate qPCR reactions).


