
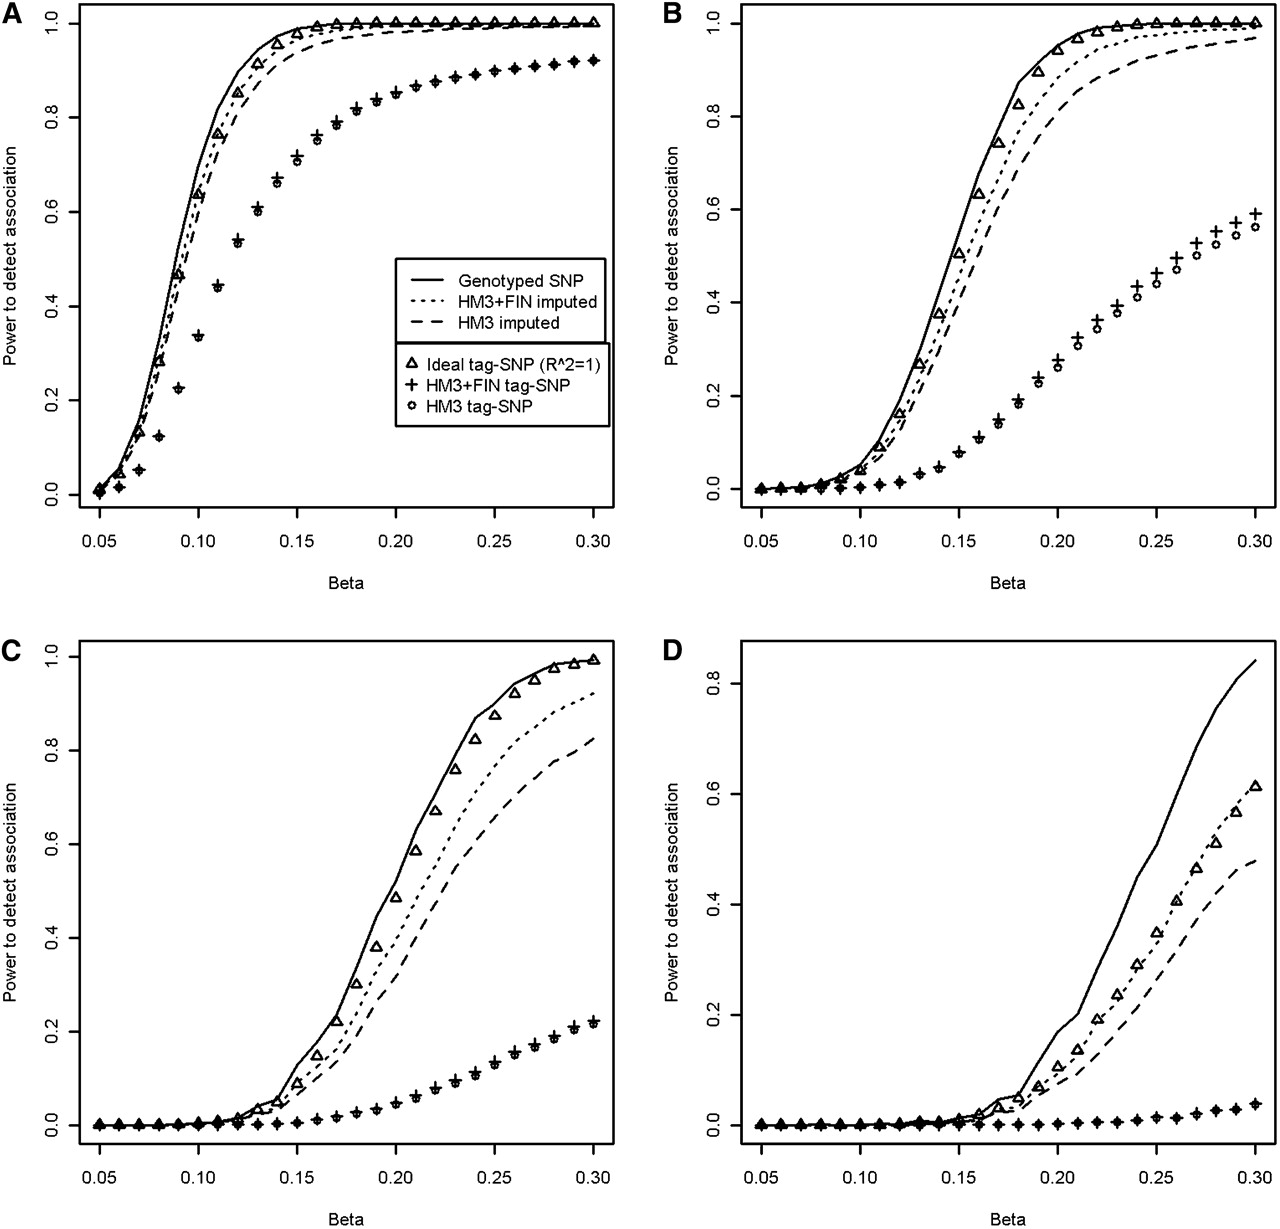
Figure 4.
Association power simulation results. Effect of the difference in R2 distributions in terms of power to detect an association is plotted separately for four different allele frequency ranges. SNPs and CNPs having a minor allele frequency between 10% and 50% (A), 5% and 10% (B), 3%–5% (C), and 0%–3% (D), including the upper limits. We have used an effective population size of 10,000 and ran 40,000 simulations for both SNPs and CNPs. The minor allele frequencies and squared linear correlations have been sampled jointly from the empirical distribution. (HM3) HapMap3 reference set; (FIN) Finnish HapMap3; (FIN + HM3) combined reference.


