
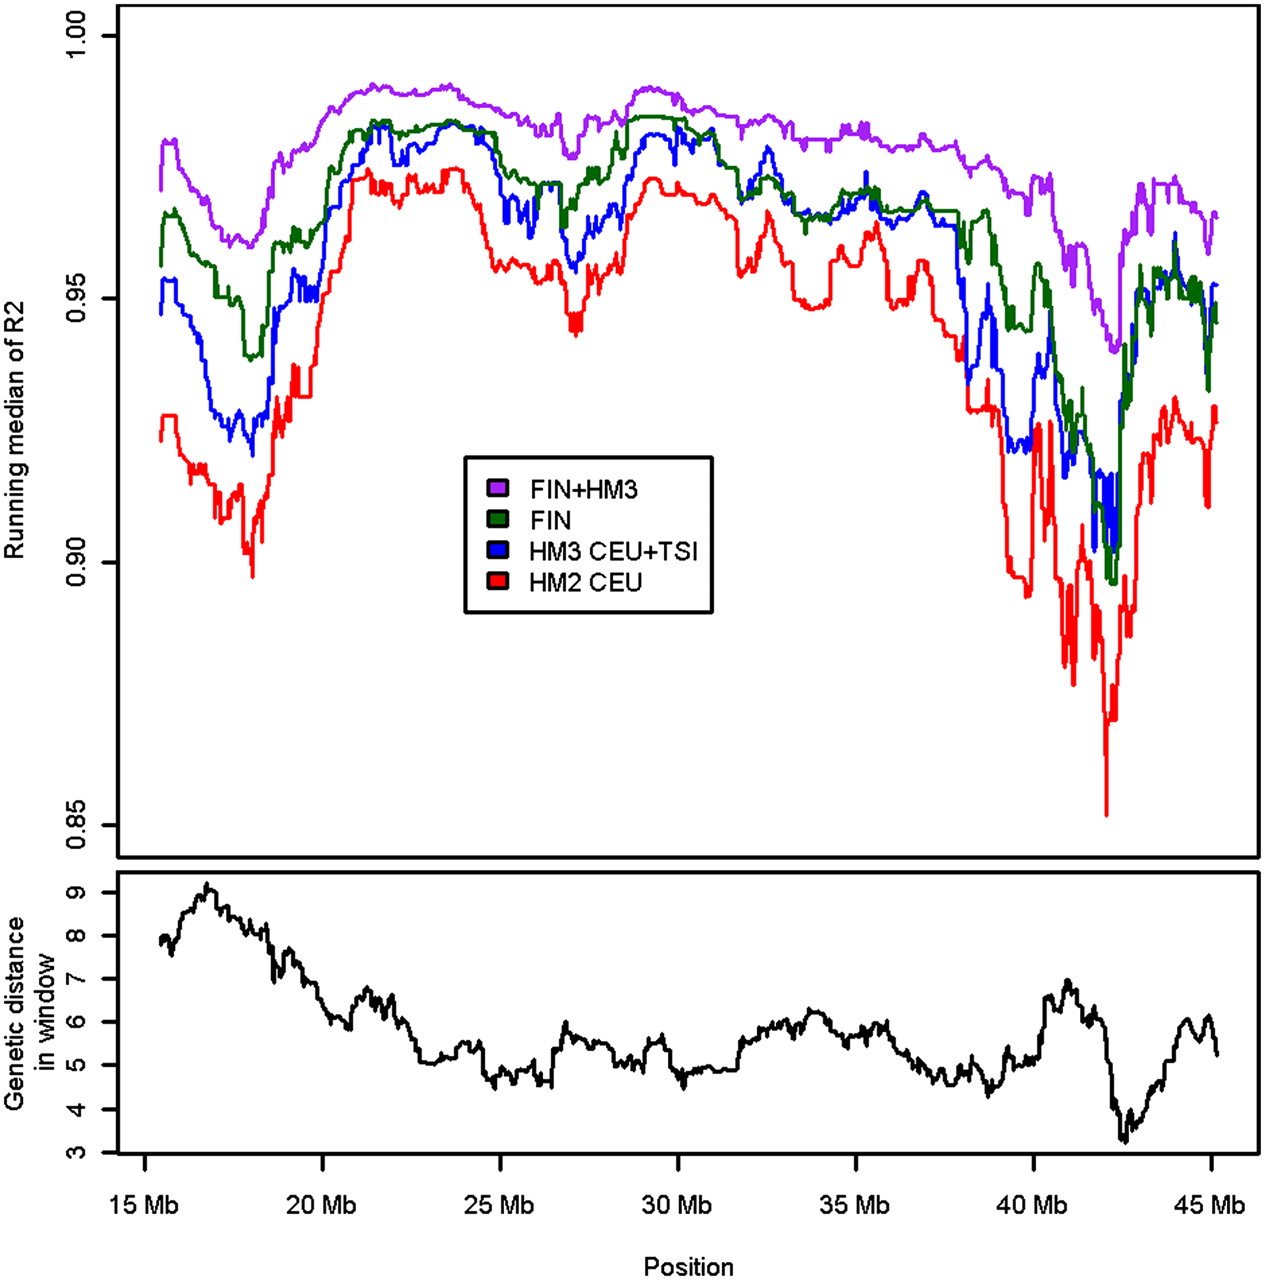
Figure 2.
Running median of squared linear correlations from the H2000 imputations. The top of the plot shows the running median of squared linear correlations between imputed allele dosages and the genotyped SNPs on chromosome 21 in the H2000 imputation with HapMap2 (HM2), HapMap3 (HM3), Finnish HapMap3 (FIN), and the combined reference, FIN + HM3. At bottom are the genetic distances, based on the recombination map of HapMap2 trios, within the windows in which the medians of R2s have been calculated.


