
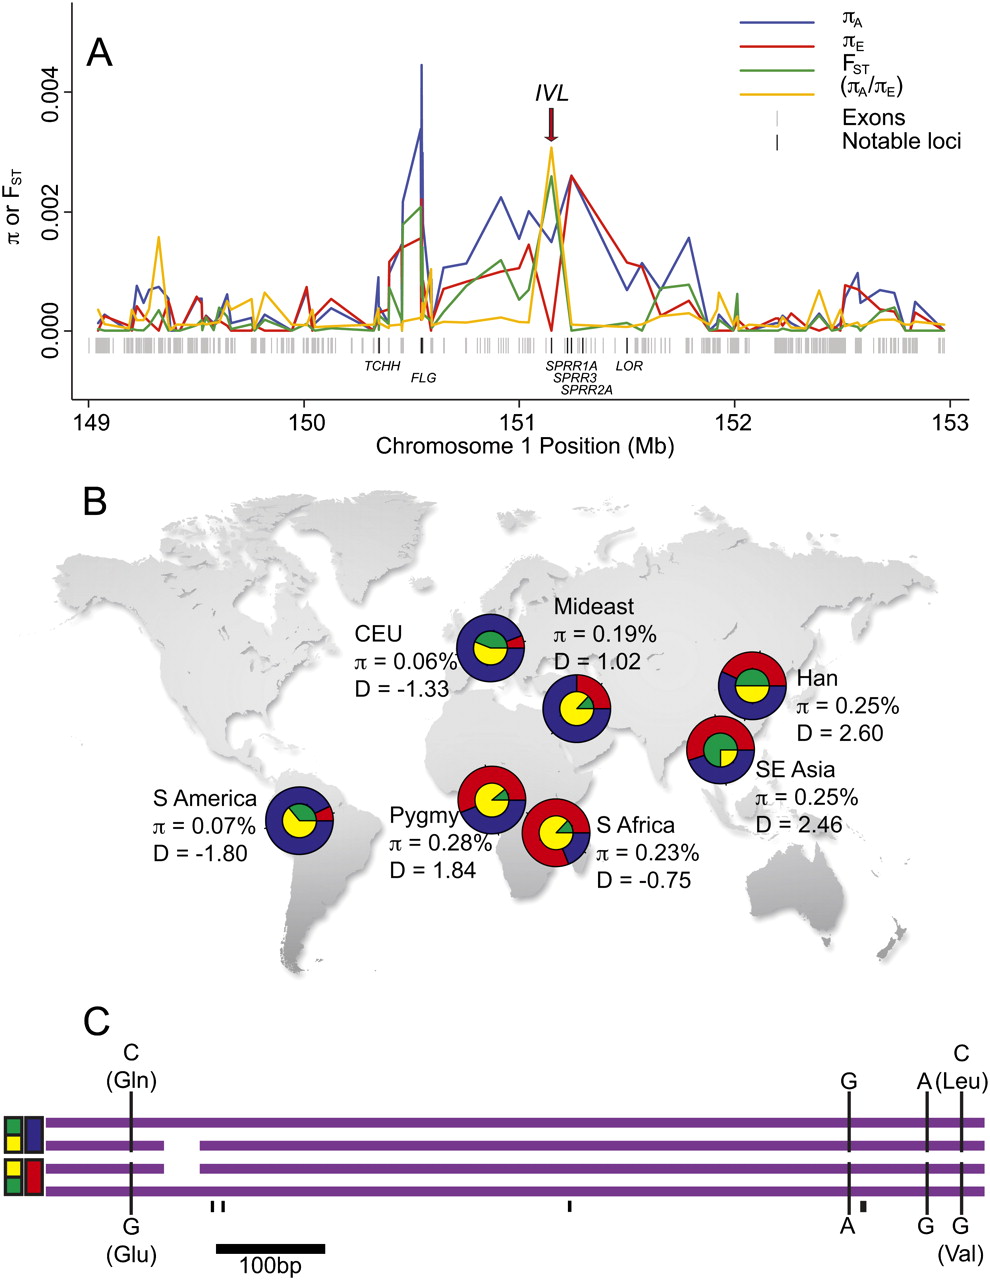
Population genetic patterns at the IVL locus. (A) Sliding window analysis of exome polymorphism and divergence in the EDC. While high π is common throughout the EDC, IVL shows very high FST, low πE, and high πA. The ratio of πA to πE has been scaled by dividing by 10,000. The positions of all exons and several notable genes that interact with IVL (Supplemental Fig. 3) are indicated. (B) Global IVL allele frequencies for SNP-based divergent haplotypes (red vs. blue) and a length polymorphism (green vs. yellow). We sequenced and analyzed a portion of IVL in seven populations: CEU (n = number of chromosomes = 34), S Africa (n = 16), Han (n = 30), Pygmy (n = 18), Mideast (n = 16), SE Asia (n = 20), and S America (n = 14). The glutamic acid carrying haplotype (red) was highest in Africa, while the glutamine carrying haplotype (blue) was highest in Europe. Tajima's D and π values varied remarkably among populations. Population differences for the green/yellow length polymorphism were less striking but still substantial between Africa/Mideast and elsewhere. (C) The four most common alleles in the 828–858-bp portion of IVL that we sequenced are shown. Four SNPs, two synonymous and two nonsynonymous, in perfect linkage disequilibrium defined two haplotypes (red and blue). An extra copy of a 30-bp repetitive sequence was present (green) or absent (yellow) on some copies of both haplotypes. All additional polymorphisms, indicated by short unmarked black lines, were rare and endemic to Africa.


