
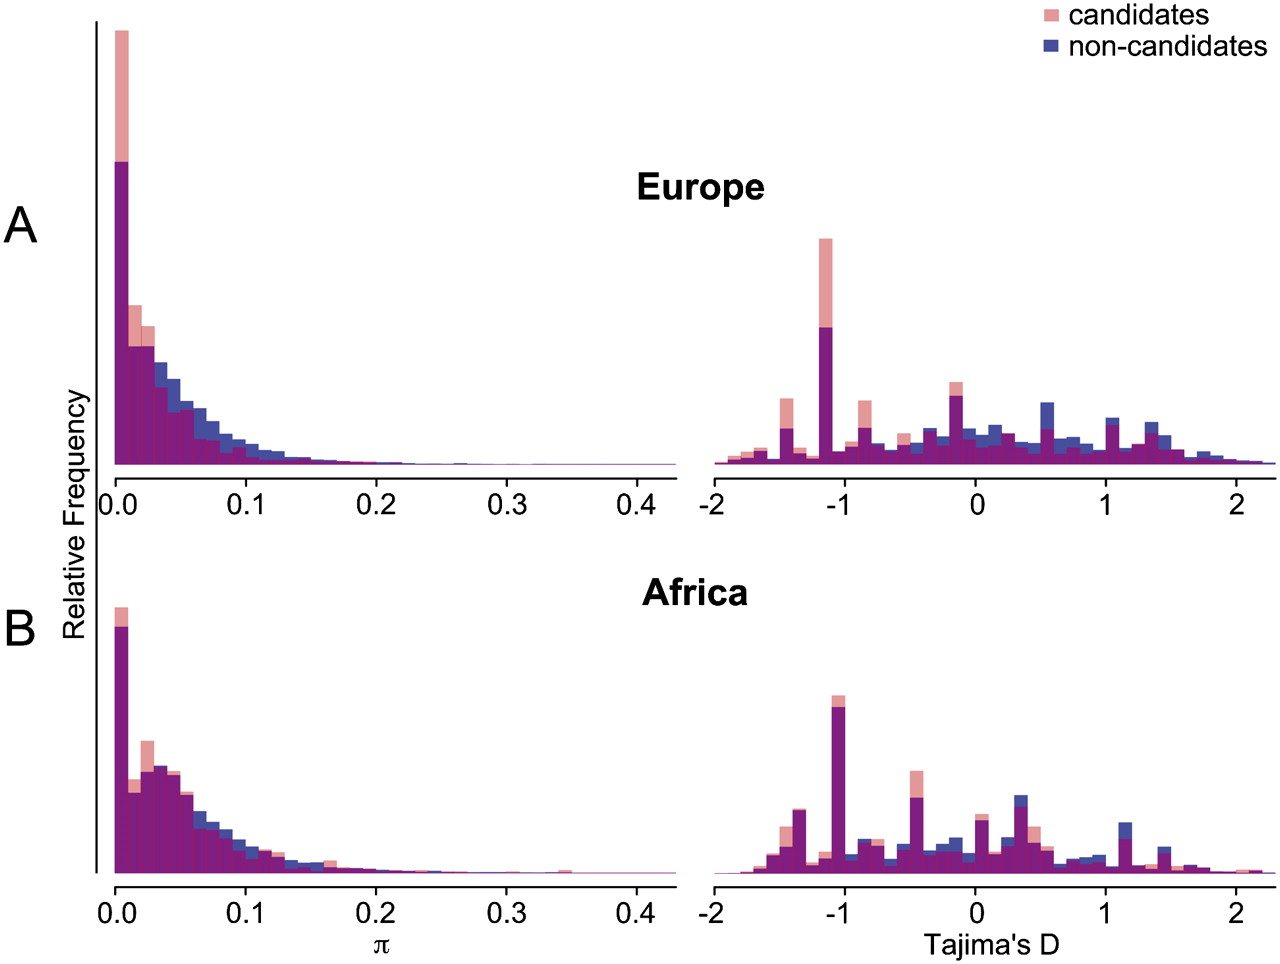
Polymorphism and site-frequency spectra for candidate and noncandidate regions. (A) Distribution of π and Tajima's D in the European sample; (B) distribution of π and Tajima's D in the African sample. Blue bars represent 100-kb regions that do not include candidate selection genes in any of the four predefined catalogs; light-red bars superimposed over these represent 100-kb regions that do include previously defined candidate selection genes; areas where the two distributions overlap are shaded purple. x-Axes are π (% per nucleotide) or Tajima's D, while y-axes are unit-less relative frequencies. For ease of visualization, very rare values beyond the ranges of these graphs are not shown, and candidate regions are scaled as if their frequency were identical to that of noncandidate regions. On each continent, ∼25% of regions show no polymorphism (far left bars). Relative to putatively neutral regions (blue bars), candidate selection loci (light-red bars) are skewed toward the left, indicating that candidate regions tend to have lower values of π and Tajima's D. Light-red bars on the right halves of the histograms represent candidate regions for which the exomes provide no supporting evidence for positive selection; eliminating these was the first step in generating filtered candidate lists (see Supplemental Tables 4–6).


