
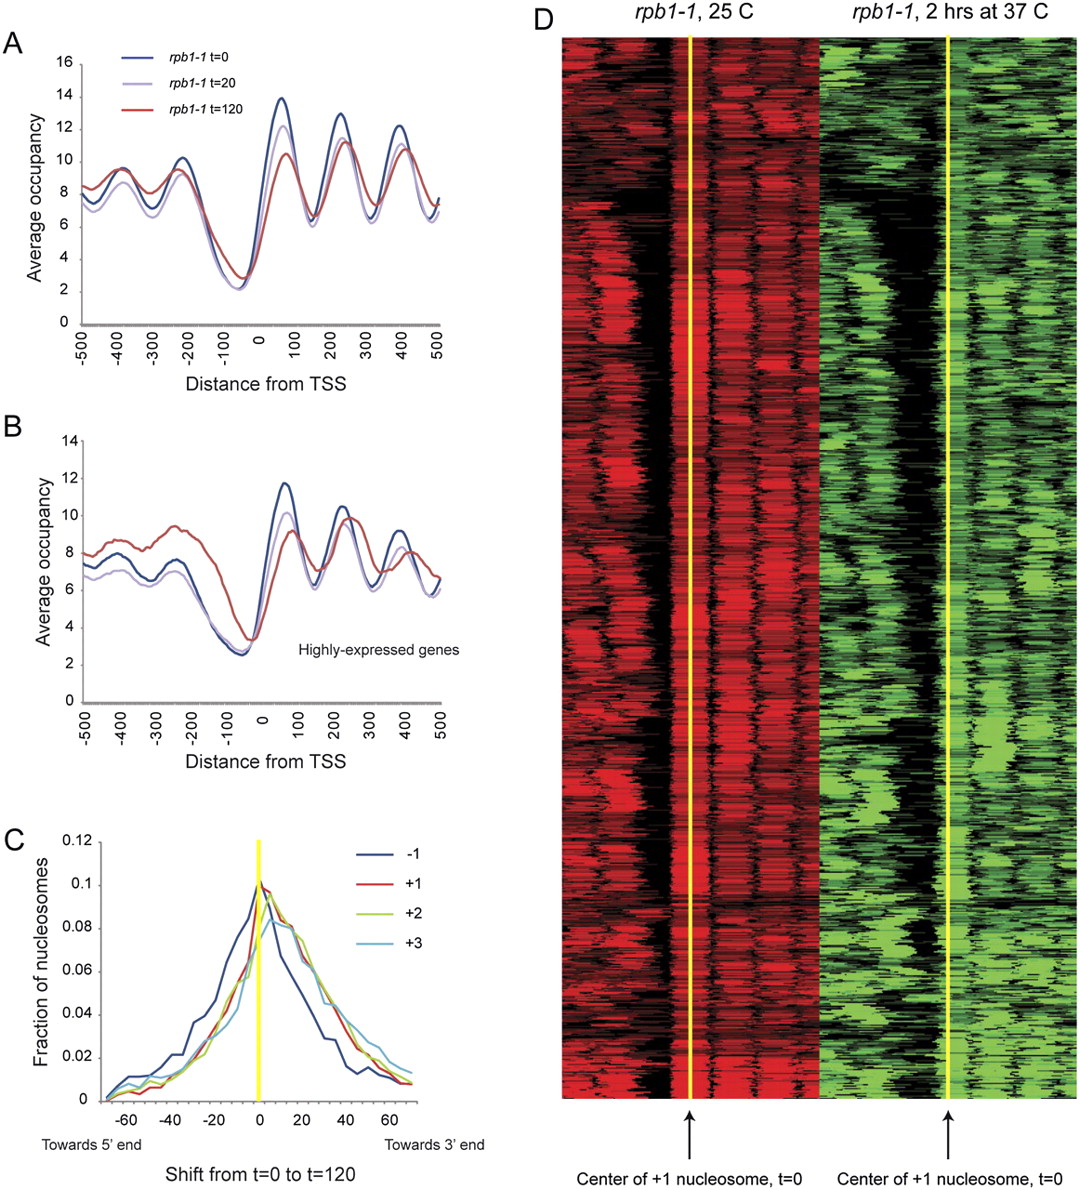
Effects of RNA polymerase on chromatin structure. (A) Nucleosomes were isolated from rpb1-1 yeast grown at 25°C, and shifted to 37°C for 20 or 120 min. Data are presented in TSS-aligned average. (B) As in A, but for highly expressed genes. (C) Nucleosomes over genes shift downstream upon Pol II loss. For each indicated nucleosome type (−1, +1, +2, +3) we plot the distribution of center-to-center distances between the nucleosome calls at 0 and 120 min after Pol II inactivation. We find that 43% of −1 nucleosomes, 59% of +1 nucleosomes, 61% of +2 nucleosomes, and 60% of +3 nucleosomes shift away from the NFR. (D) Global view of +1 nucleosome shifts during Pol II inactivation. Nucleosome calls for all promoters with a downstream +1 nucleosome shift are shown as a heatmap, aligned by the center of the +1 nucleosome (yellow) before Pol II inactivation (red). After 2 h of Pol II inactivation (green), downstream shifts of these 59% of +1 nucleosomes are apparent.


