
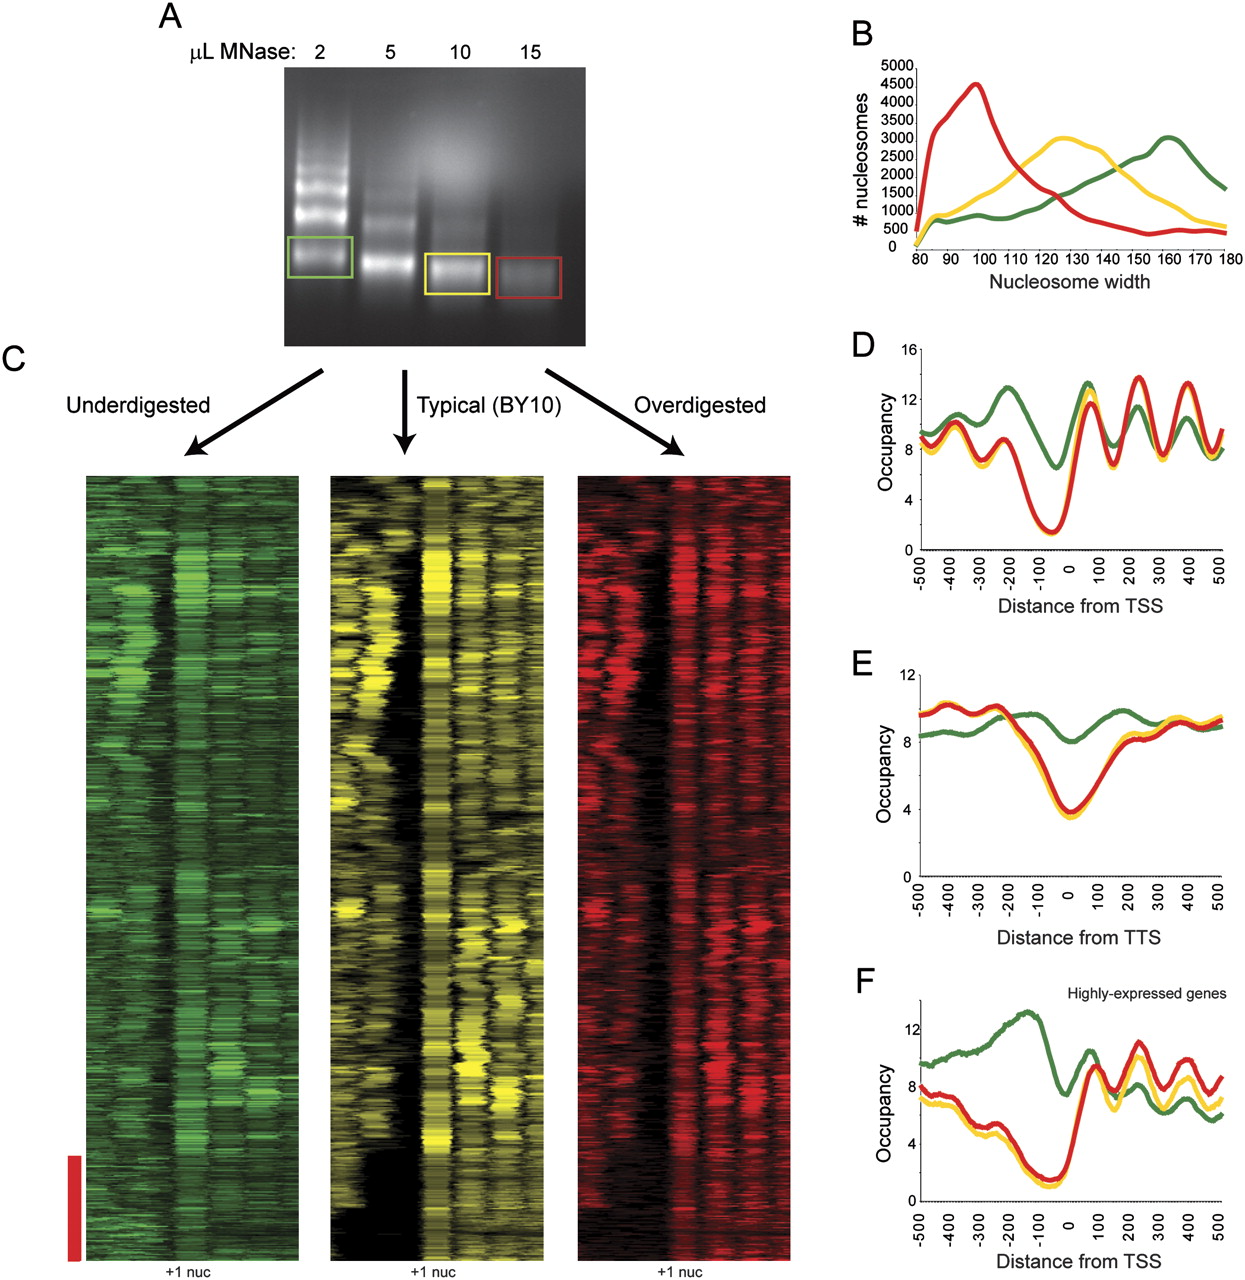
Effects of MNase level on chromatin structure. (A) Mononucleosomal DNA was isolated from ladders from three different MNase titration levels, and sequenced by Illumina sequencing. (B) Data from titration series was subjected to template filtering to generate nucleosome calls. Width distributions for nucleosomes from the three titration steps are plotted. Green, yellow, and red correspond to under-, mid-, and overdigested chromatin, respectively. (C) Data for under- (green), mid- (yellow), and over- (red) digested chromatin is shown in cluster view. Genes are aligned using BY10 +1 nucleosome center (indicated); all three clusters have genes ordered by clustering for BY10 data. Red bar indicates genes with wide NFRs in mid- and overdigested chromatin (largely highly expressed genes such as ribosomal genes), which are partially filled in underdigested chromatin. (D) TSS-aligned nucleosome occupancy data for all genes. (E) Stop-codon-aligned nucleosome occupancy for all genes. (F) As in D, but only for genes with Pol II ChIP occupancy >1, top 7% of genes.


