
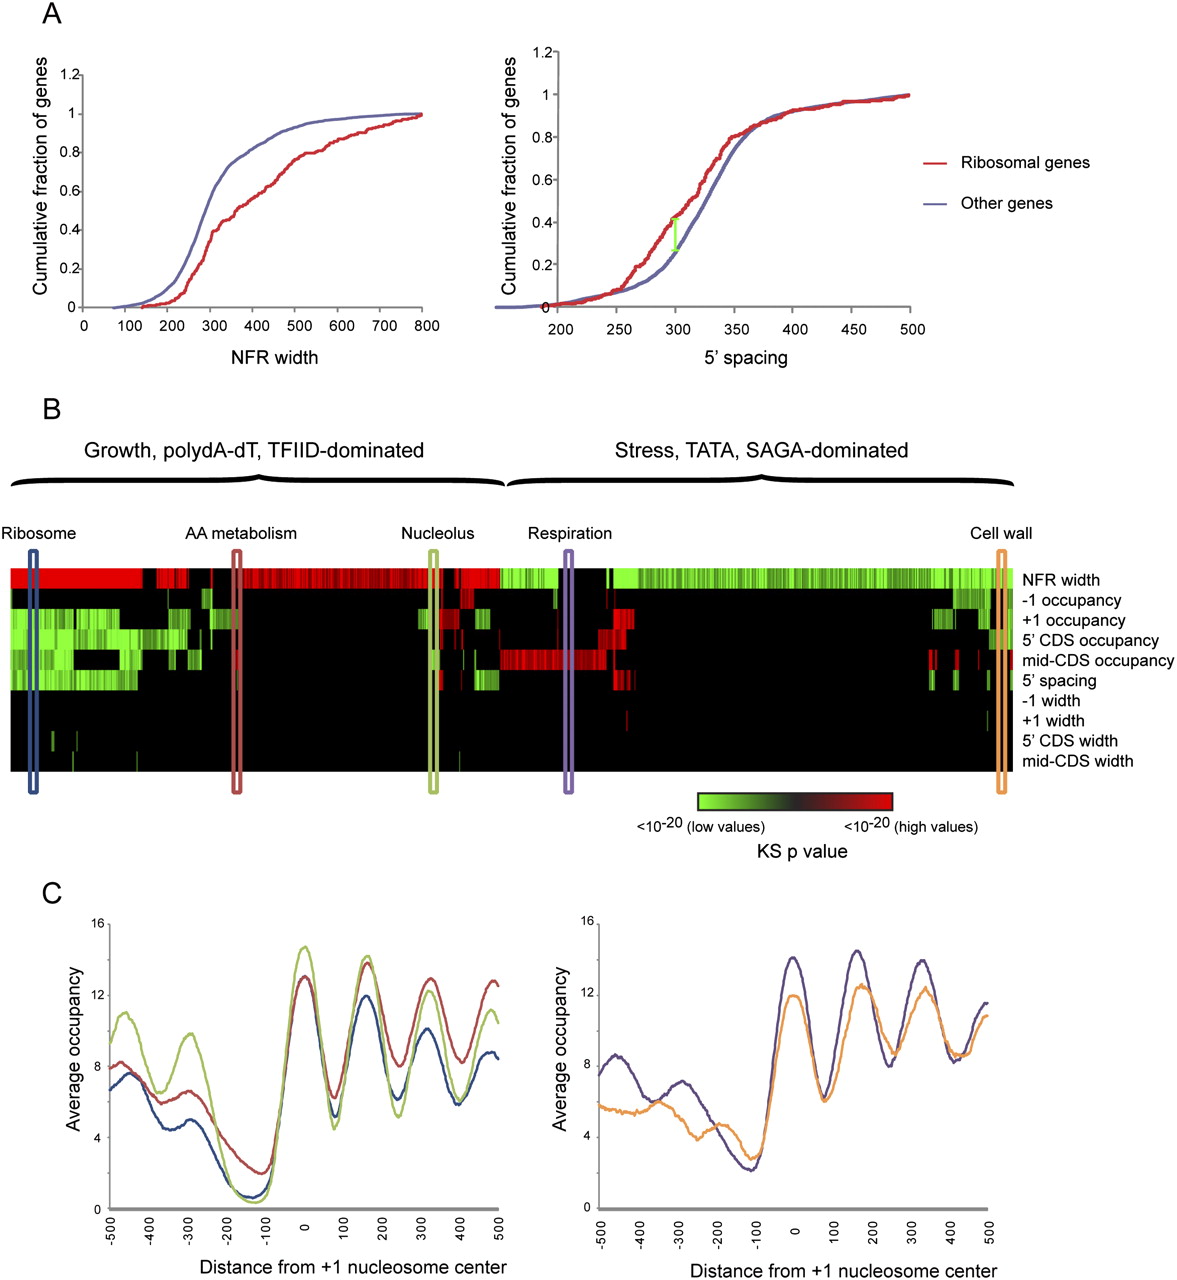
Different promoter types are differently packaged. (A) Cumulative distribution function (CDF) plots for two significant Kolmogorov-Smirnov (KS) enrichments. The gene set of 270 ribosomal genes is enriched for long NFRs (left), and close +1 to +3 nucleosome spacing (right). For example, 45% of ribosomal genes have 5′ nucleosome spacing of <300 bp (green line), whereas only 25% of all genes have this spacing. (B) Enrichment of high or low values of various parameters for a set of promoter types. Various parameters such as +1 nucleosome occupancy (listed at right) were extracted for all yeast promoters. Each of the gene sets previously gathered (Dion et al. 2007; Wapinski et al. 2007) was tested (using KS test) for significantly high or low values of the various parameters. Significant (FDR < 0.05) high values are shown in red, and significant low values are in green. Colors represent log10 of the P-value of the KS enrichment (saturated at P < 1 × 10⁻²⁰). Colored elongated boxes indicate gene classes evaluated in C. (C) Averages for five promoter types as indicated in B, aligned according to +1 nucleosome center. The y-axis represents average normalized nucleosome occupancy, in number of reads per million mappable reads.


