
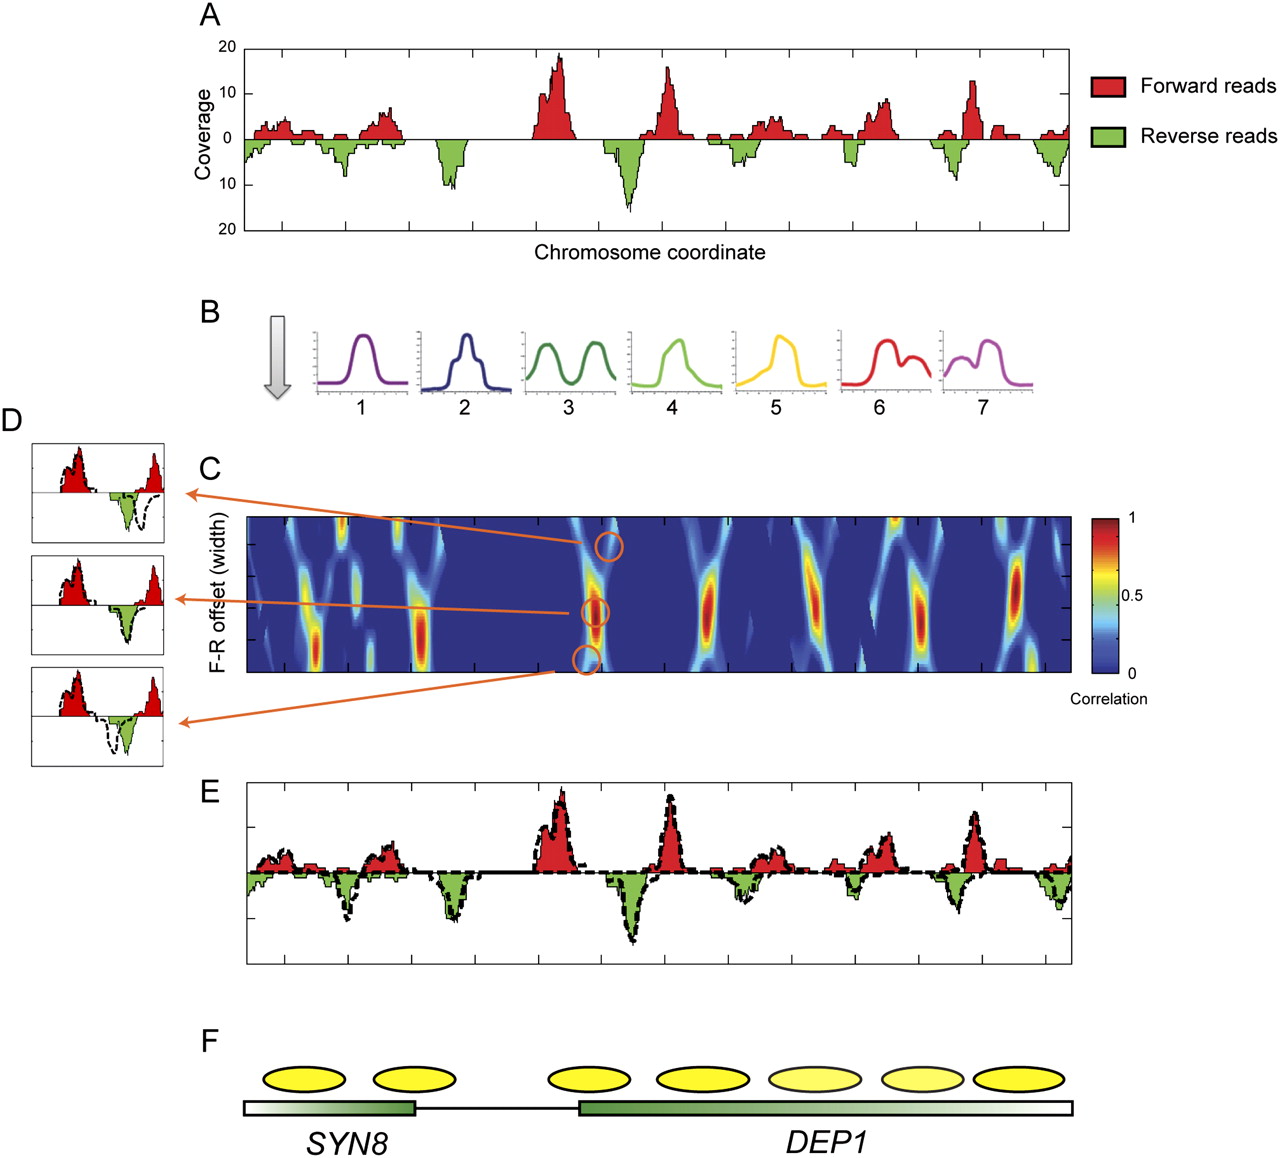
Template filtering overview. (A) Deep sequencing data for a typical stretch of the yeast genome. Coverage by forward-strand sequencing reads are shown as red peaks, whereas coverage by reverse-strand sequencing reads are shown as inverted green peaks. (B) Templates. Forward and reverse-strand read distributions are cross-correlated with each of the seven templates shown. (C) Correlation coefficient heat map of template 1 for forward and reverse templates at varying center positions (x-axis) and distances (y-axis). (D) Examples of templates spaced too far apart (top), at the optimal distance (middle), or too close together (bottom). Dotted lines indicate template outlines being compared with the underlying data. (E) Read distributions explained by the optimal template matches are shown as dotted lines for the region in A. (F) Schematic of nucleosome calls and underlying gene annotations.


