
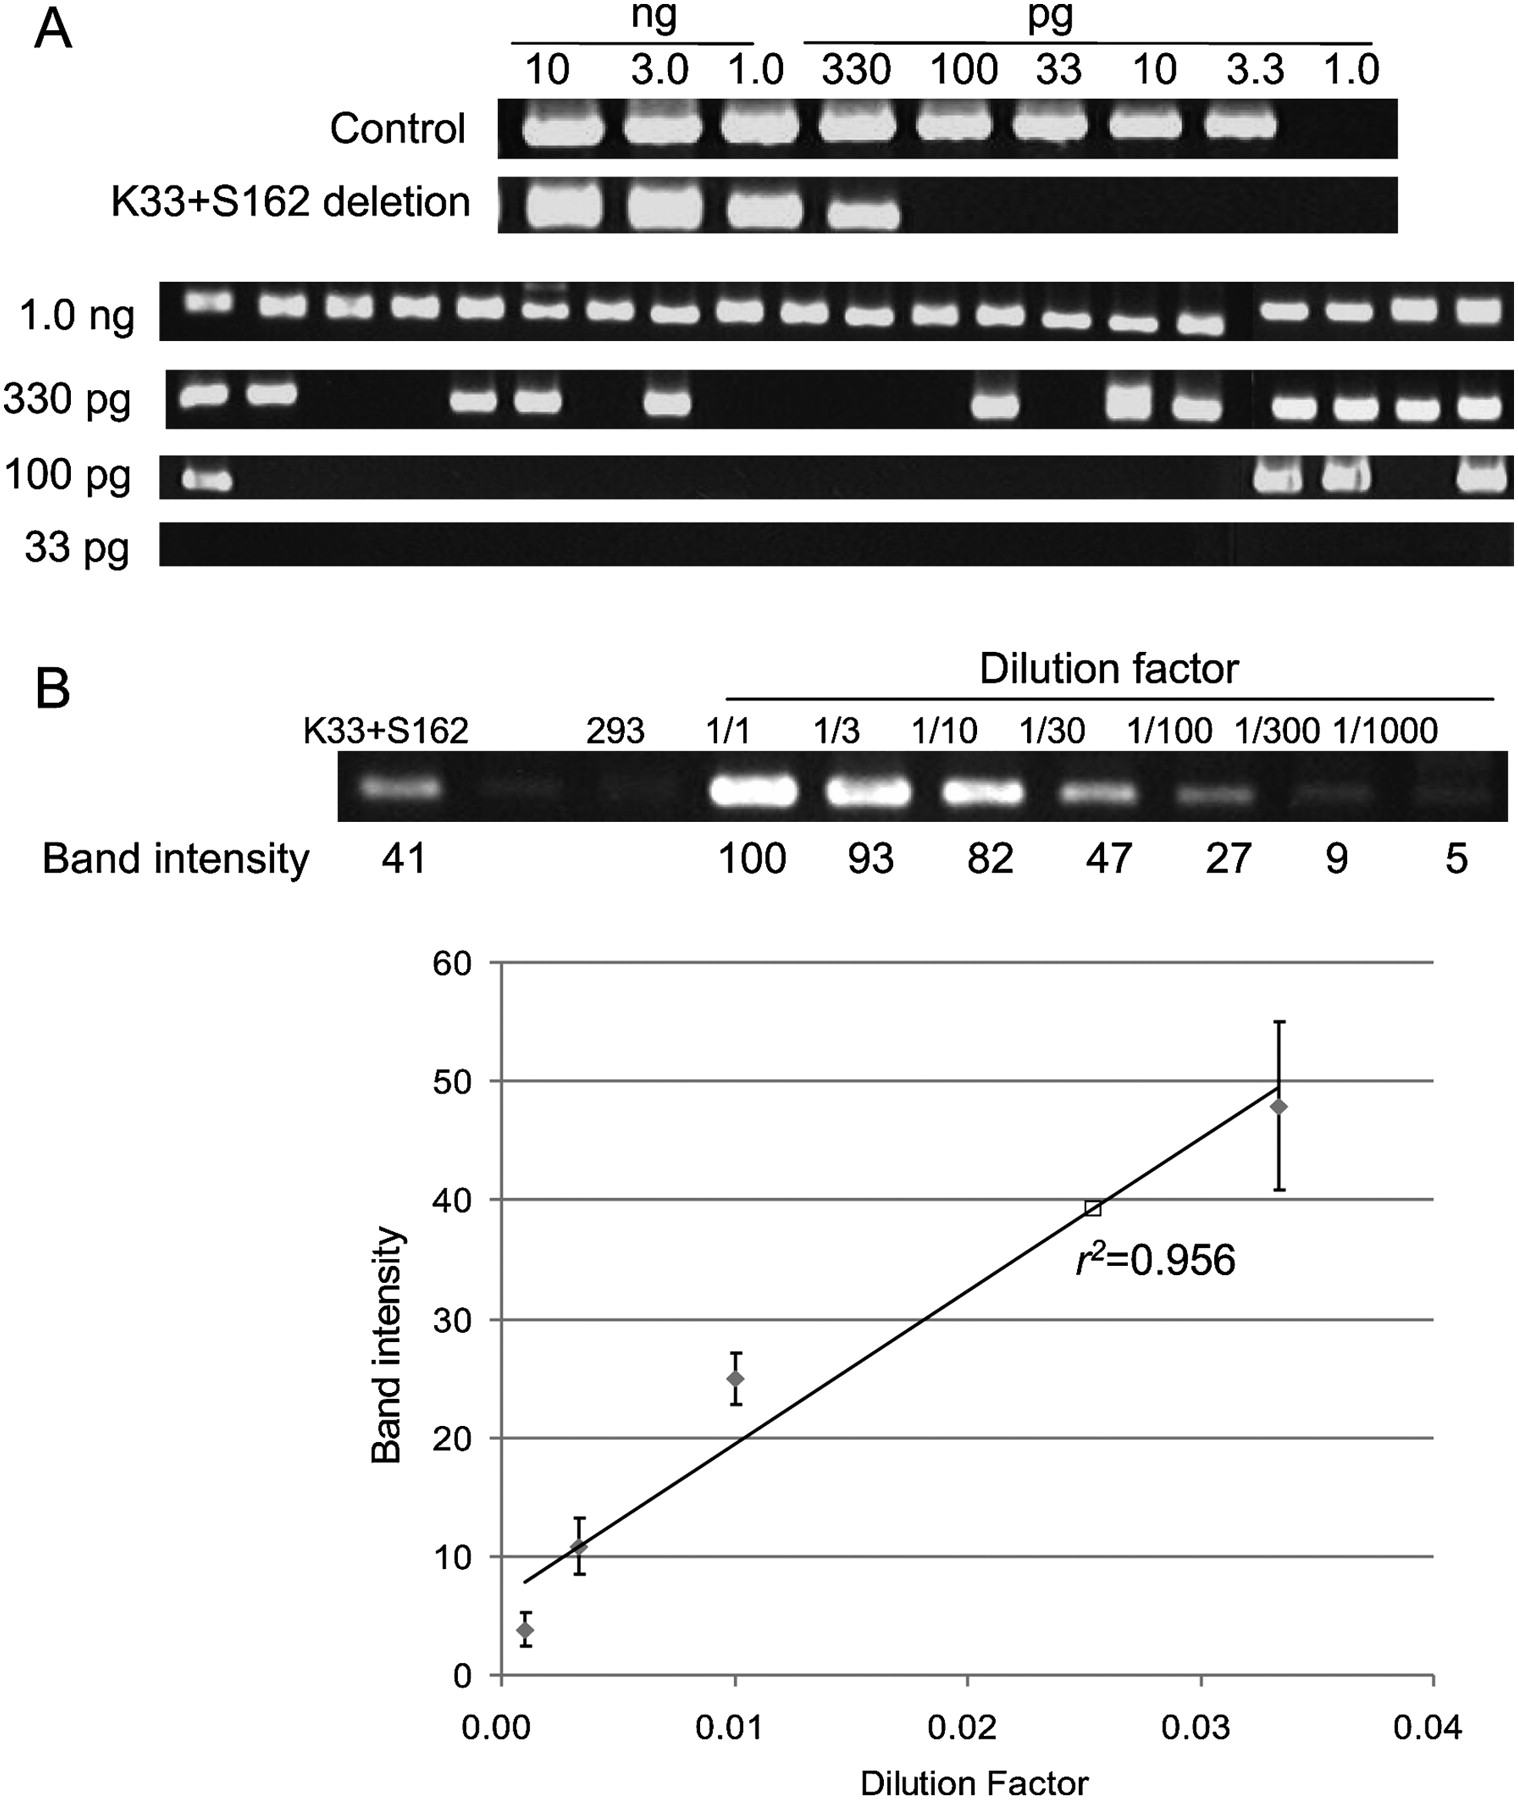
Frequencies of genomic deletions induced by ZFNs. (A) “Digital” PCR analysis. (Upper panel) Genomic DNA isolated from cells cotransfected with plasmids encoding K33 and S162 were serially diluted in a buffer and subjected to PCR analysis in a reaction volume of 10 μL. (Lower panel) At critical dilution points, PCR was performed in 20 aliquots. (B) A standard curve for the estimation of deletion frequencies. A plasmid containing a PCR product corresponding to the 33-kbp genomic deletion induced by ZFNs was serially diluted in a solution containing genomic DNA isolated from HEK 293 cells and the diluted samples were subjected to PCR analysis. Intensities of DNA bands corresponding to the deletion event were measured and plotted against dilution factors. At high values, band intensities reached plateau and thus were excluded when the standard curve was plotted. The open square corresponds to the PCR product from cells treated with ZFNs.


