
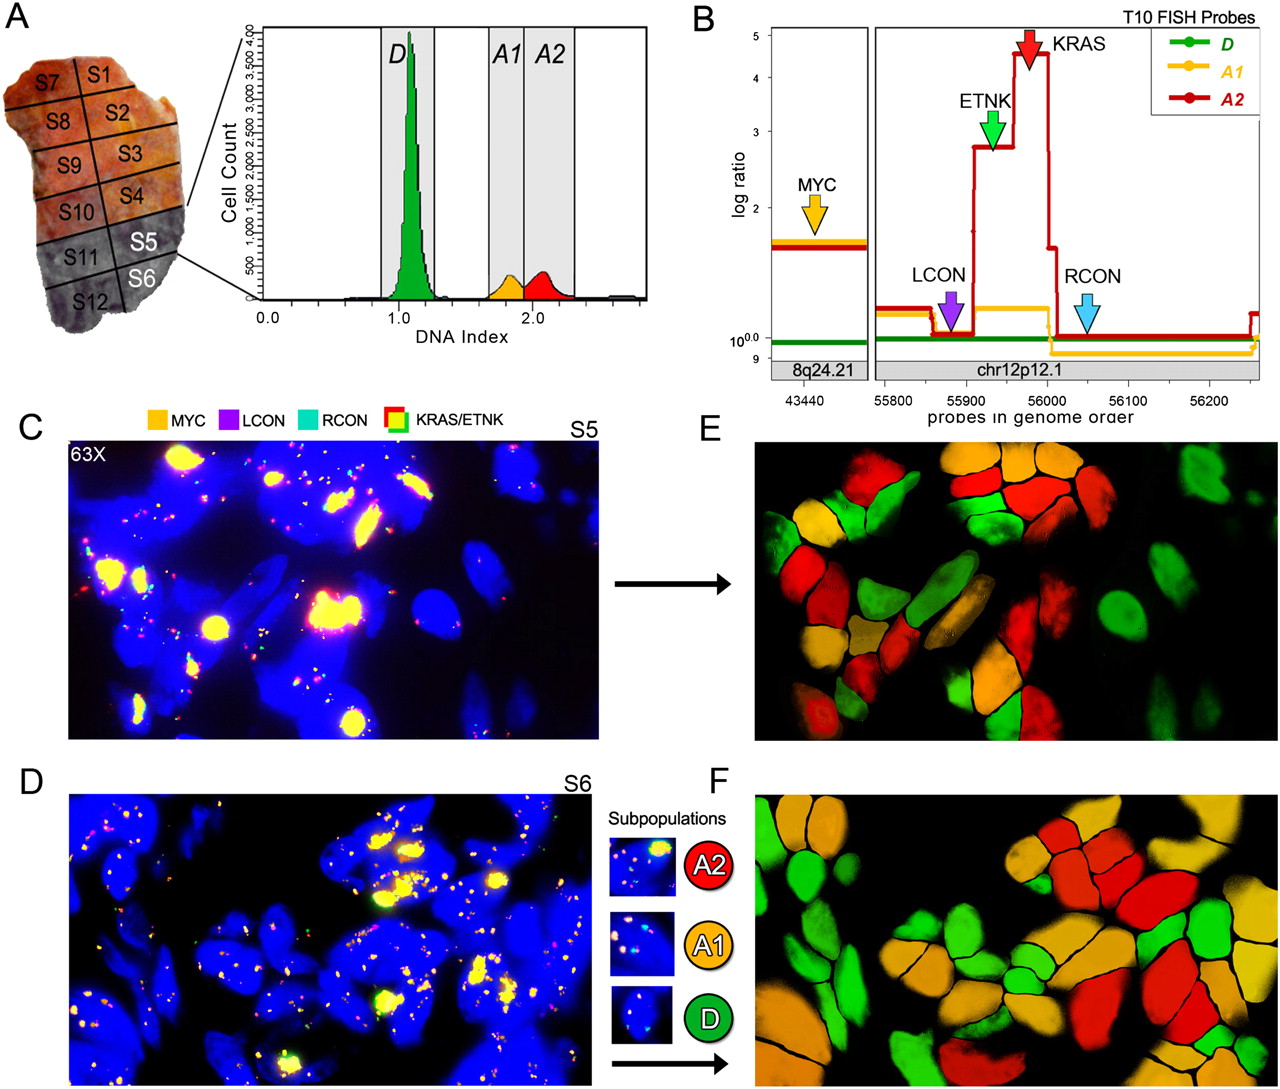
Intermixing of tumor subpopulations in tissue sections. A FISH probe strategy was used to mark chromosomes that are differentially amplified in two tumor subpopulations (A1 and A2) in tissue sections from sector 5 and sector 6 of T10. (A) Tumor T10 contains four sectors (S11, S12, S5, S6) with similar FACS histograms. The FACS histogram from sector 5 is shown and contains one diploid peak (green) and two aneuploid peaks that were gated and analyzed by CGH (yellow and red). (B) Segmented copy number data are plotted with FISH probes annotated to show the strategy for distinguishing the diploid cells from the A1 and A2 tumor subpopulations. The MYC probe on chromosome 8q24.21 (orange) detects two copies in the diploid cells and three copies in both of the tumor subpopulations (A2 and A3). LCON (purple) and RCON (blue) are control FISH probes on Chr12p12.1 that report two copies in all of the subpopulations. The KRAS (red) and ETNK (green) probes report six to 10 copies in the A2 subpopulation, but not in A1. (C,D) Tissue sections from T10 sector 5 show three types of cells: D diploid, A1 tumor cells, and A2 tumor cells. Diploid cells contain two copies of all of the probes. A1 tumor cells contain three copies of MYC and two copies of the other probes. The A2 tumor cells display a bright yellow signal resulting from the colocalization of the KRAS and ETNK probes, which are present in high copy number. (E,F) DAPI channels are false-colored to show the location of the three cell types: D (green), A1 (yellow), and A2 (red) in the tissue sections from panels C and D. The three cell types are stochastically intermixed in the tissues.


