
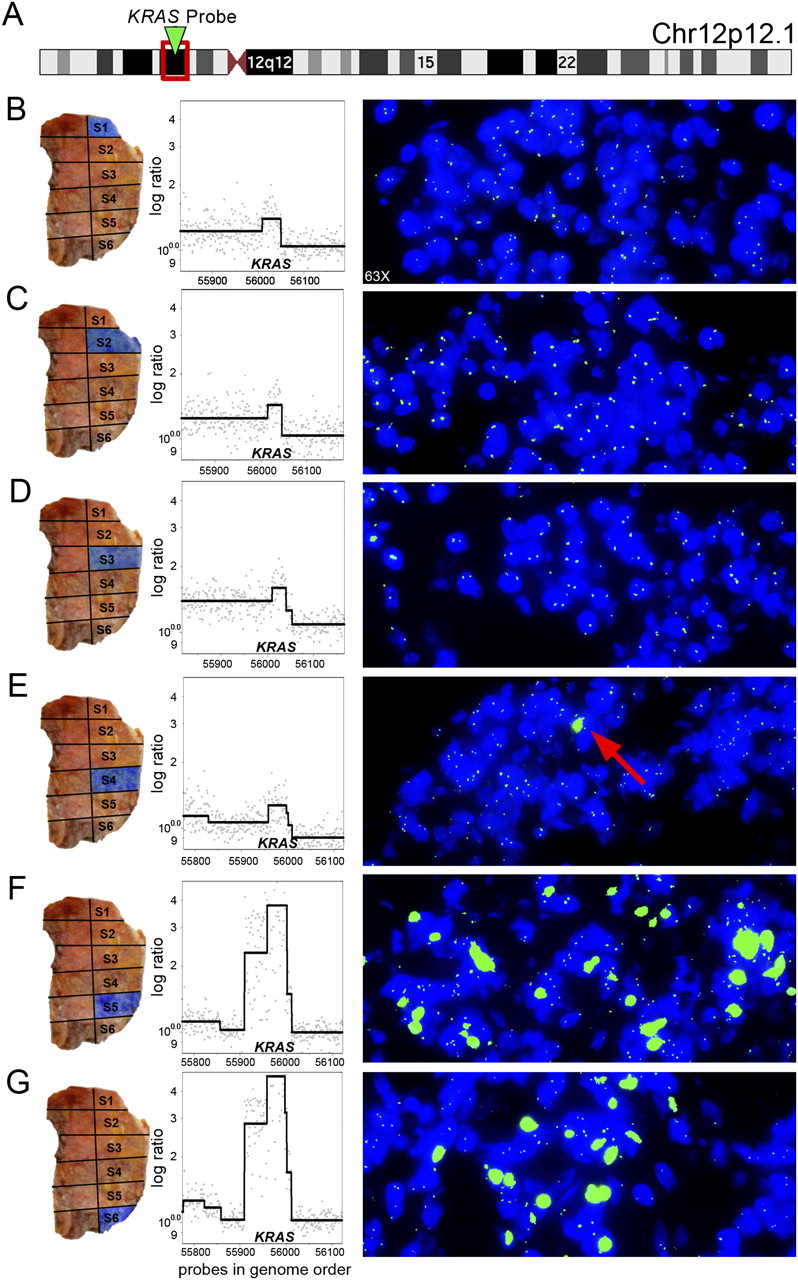
Regional amplification of the KRAS locus. Tissue sections from sectors 1–6 from tumor T10 are hybridized with a single FISH probe specific to the KRAS locus. (B–G, left) The topography of each tumor sector from which the tissues sections are cut. The log ratio and segmented copy number data of the KRAS amplification are also shown for each tumor sector. (A) Ideogram showing the cytobands and location of the KRAS FISH probe on chromosome 12p12.1. (B–D) Tissue sections from sectors 1–3 show two or three copies of the KRAS locus in the stromal and tumor cells. (E) Sector 4 contains a majority of tumor and stromal cells with two or three copies of the KRAS locus; however, one tumor cell shows a massive amplification of the KRAS locus. (F–G) Sectors 5 and 6 show numerous tumor cells with a high copy number of KRAS as a homologous staining region intermixed with other stromal and tumor cells that contain two or three copies of the KRAS locus.


