
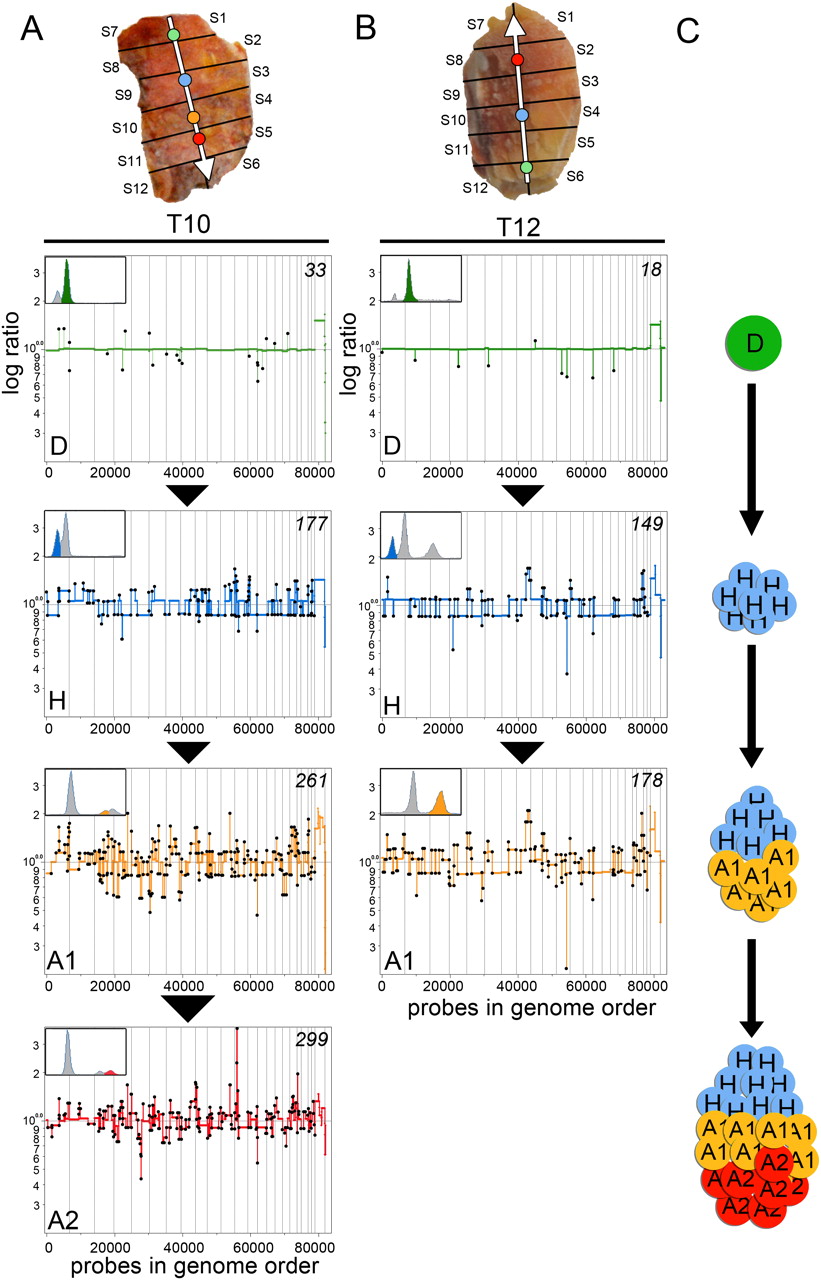
Genomic progression from hypodiploid to hyperaneuploid. Coalesced, segmented copy number profiles are ordered in increasing numbers of chromosome breakpoints. The topography of the subpopulations in the tumor sectors is shown with a white vector to indicate the direction of progression. FACS histograms are shown with the gated subpopulation highlighted in color. (A) Tumor T10 progresses from diploid (D) (green) to hypodiploid (H) (blue), to hyperaneuploid (A1) (yellow), to hyperaneuploid (A2) (red), as the number of chromosome breakpoints increases. (B) Tumor T12 progresses from diploid (D) (green) to hypodiploid (H) (blue) to hyperaneuploid (A1) (yellow). (C) Illustration of the clonal expansion of subpopulations that occur as the tumor grows.


