
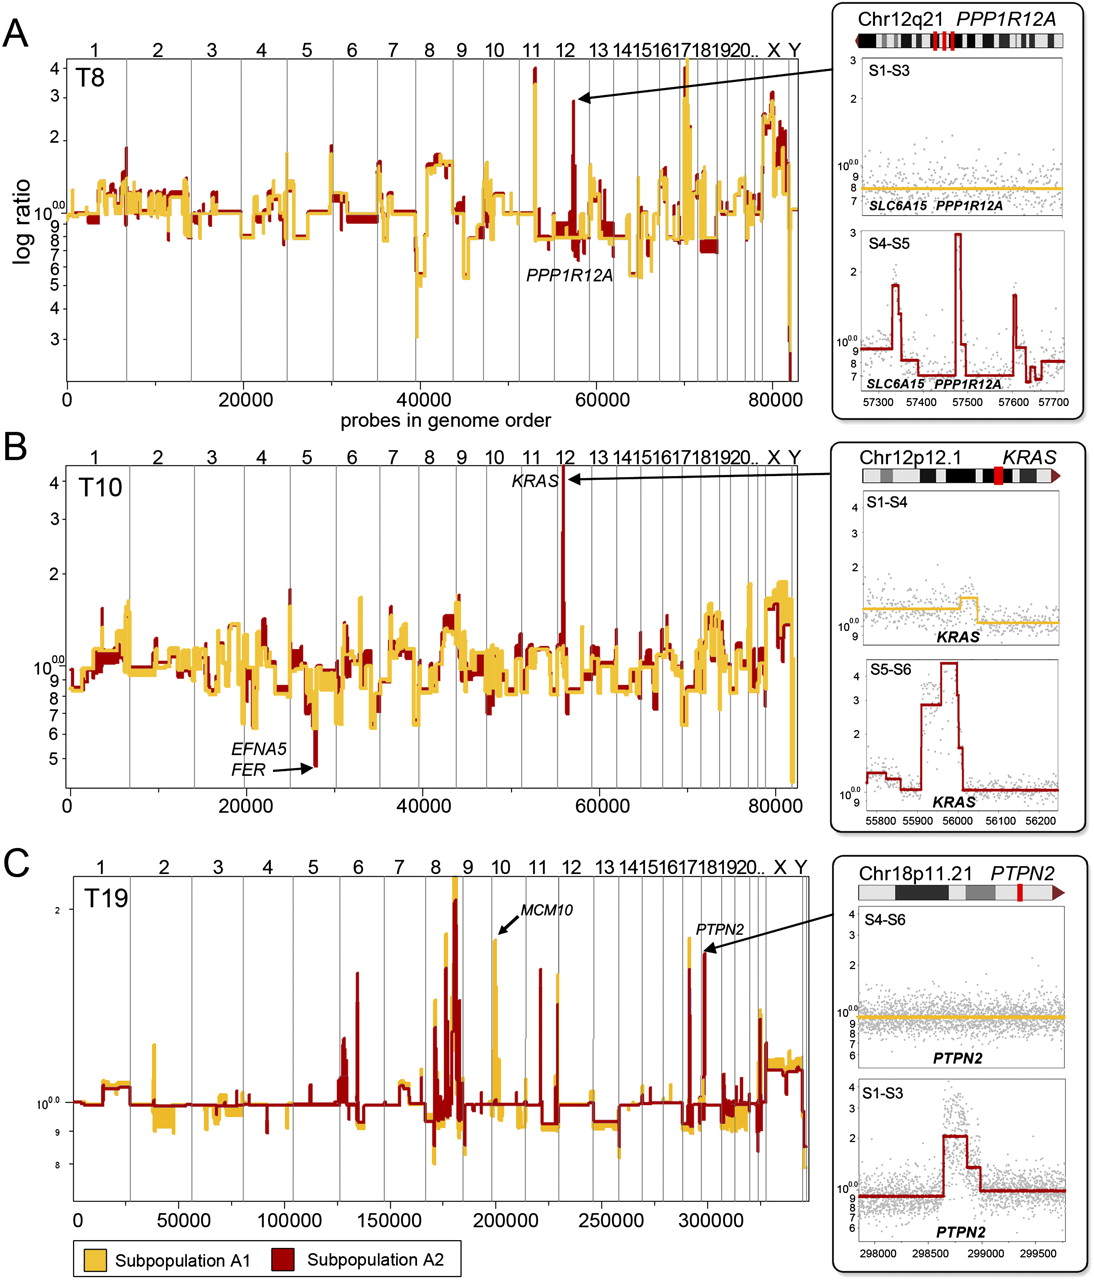
Focal lesions that differ between subpopulations in single tumors. Segmented log ratio CGH data from coalesced tumor profiles are plotted in genome order. (A) Tumor T8 contains three focal amplifications, including the amplification of the PPP1R12A locus on Chr12q21, which is present in the A2 tumor subpopulation (red), but absent in A1 (yellow). (B) Tumor T10 contains a focal amplification of the KRAS locus on Chr12p12.1, which is present in the A2 tumor subpopulation (red), but absent in A1 (yellow). T8 also contains a homozygous deletion of the EFNA5 and FER locus on Chr5q21.3 in the (red) A2 subpopulations that is hemizygously deleted in A1 (yellow). (C) Tumor T19 contains a focal amplification of the PTPN2 locus on Chr18p11.21, which is present in the A2 subpopulation (red), but absent in A1 (yellow). T19 also contains a focal amplification of the MCM10 locus on Chr10p13 in the A1 tumor subpopulation that is absent in A2.


