
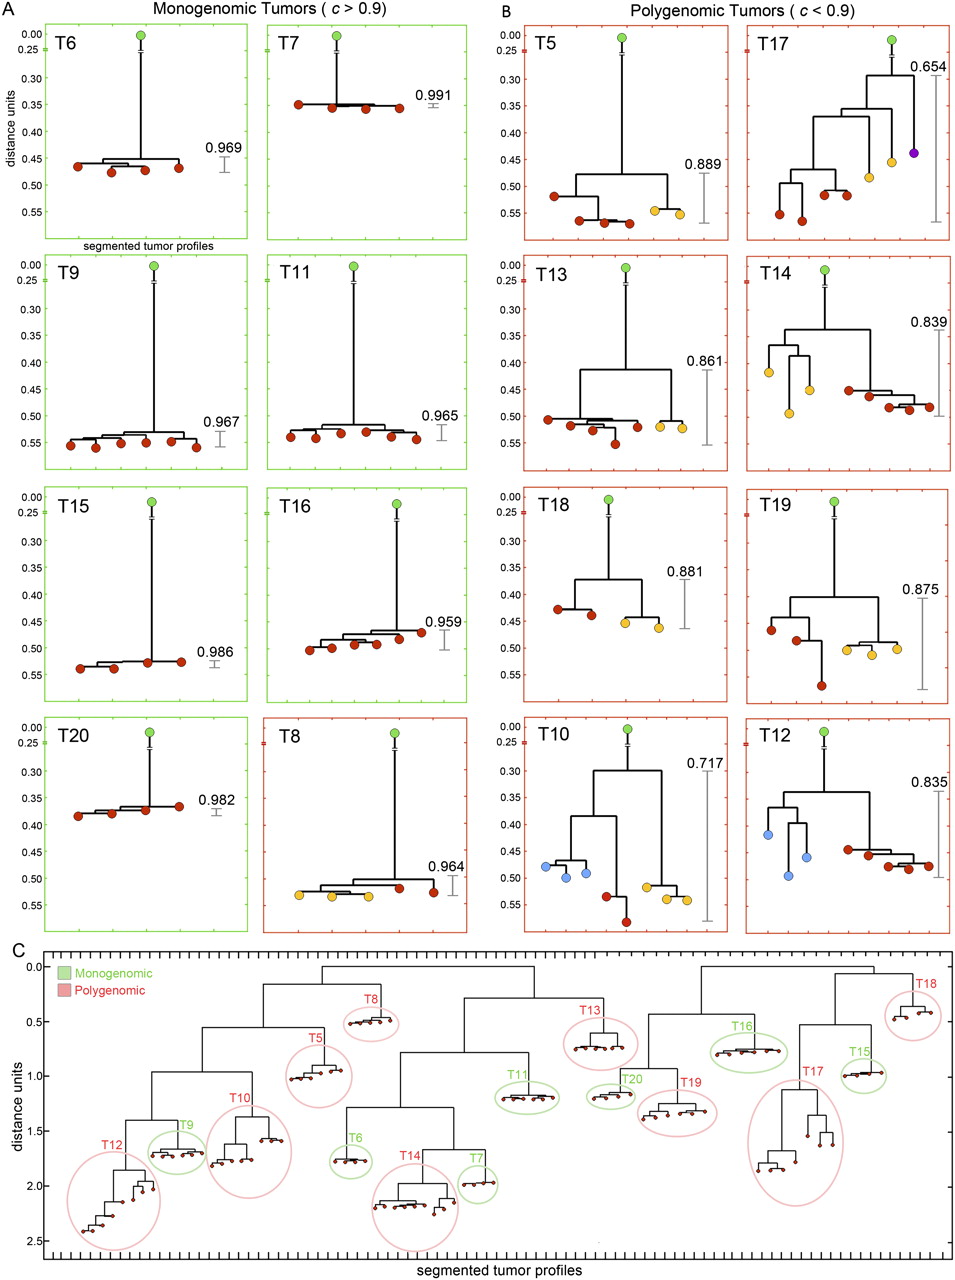
Distance trees of copy number profiles. Neighbor-joining trees were constructed from distance trees by calculating 1-correlation matrices of all copy number profiles in a single tumor. (Green) The trees were rooted with a single coalesced diploid profile. (Green) Monogenomic tumors; (red) polygenomic tumors. (Red, yellow, blue) The leaves are colored to show different subpopulations as determined by comparing ROMA copy number profiles. (A) Tumor trees with a minimum correlation coefficient > 0.9. (B) Tumor trees with a minimum correlation coefficient < 0.9. (C) Distance trees of all tumor profiles without a diploid root node. Two trees were calculated separately: one from 85K experiments (T4–T14) and one from the 390K experiments (T15–T20).


