
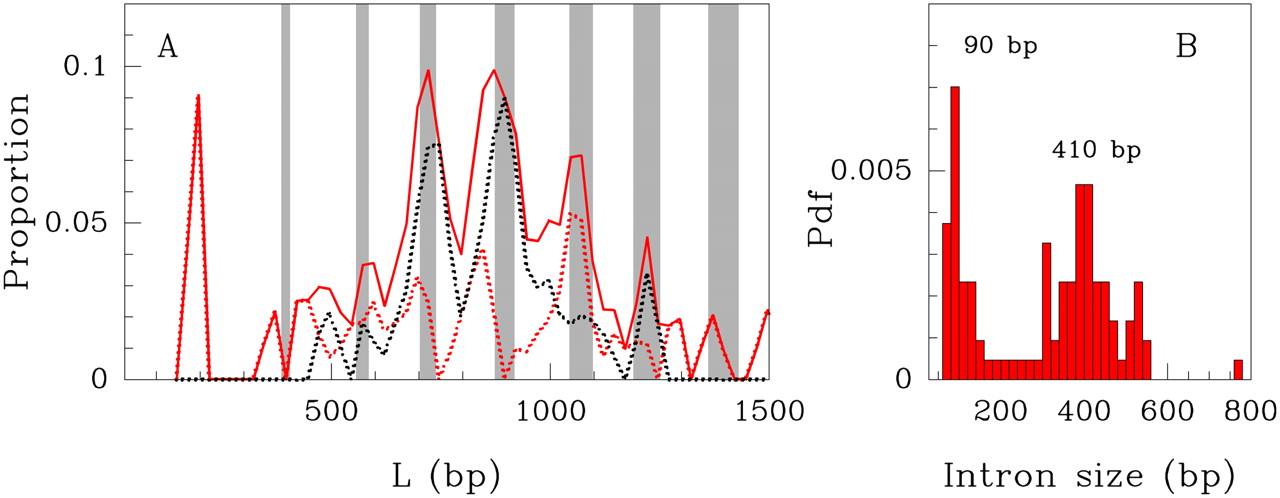
Figure 6.
(A) Proportion of single intron containing yeast genes (107/4554) as a function of the gene size L; the vertical gray bands define bi-stability domains. The dotted curves correspond to the density of ribosomal protein genes (54) (black dotted curve) and to the density of the nonribosomal protein genes (53) (red dotted curve). (B) Histogram of intron sizes in single-intron containing genes.


