
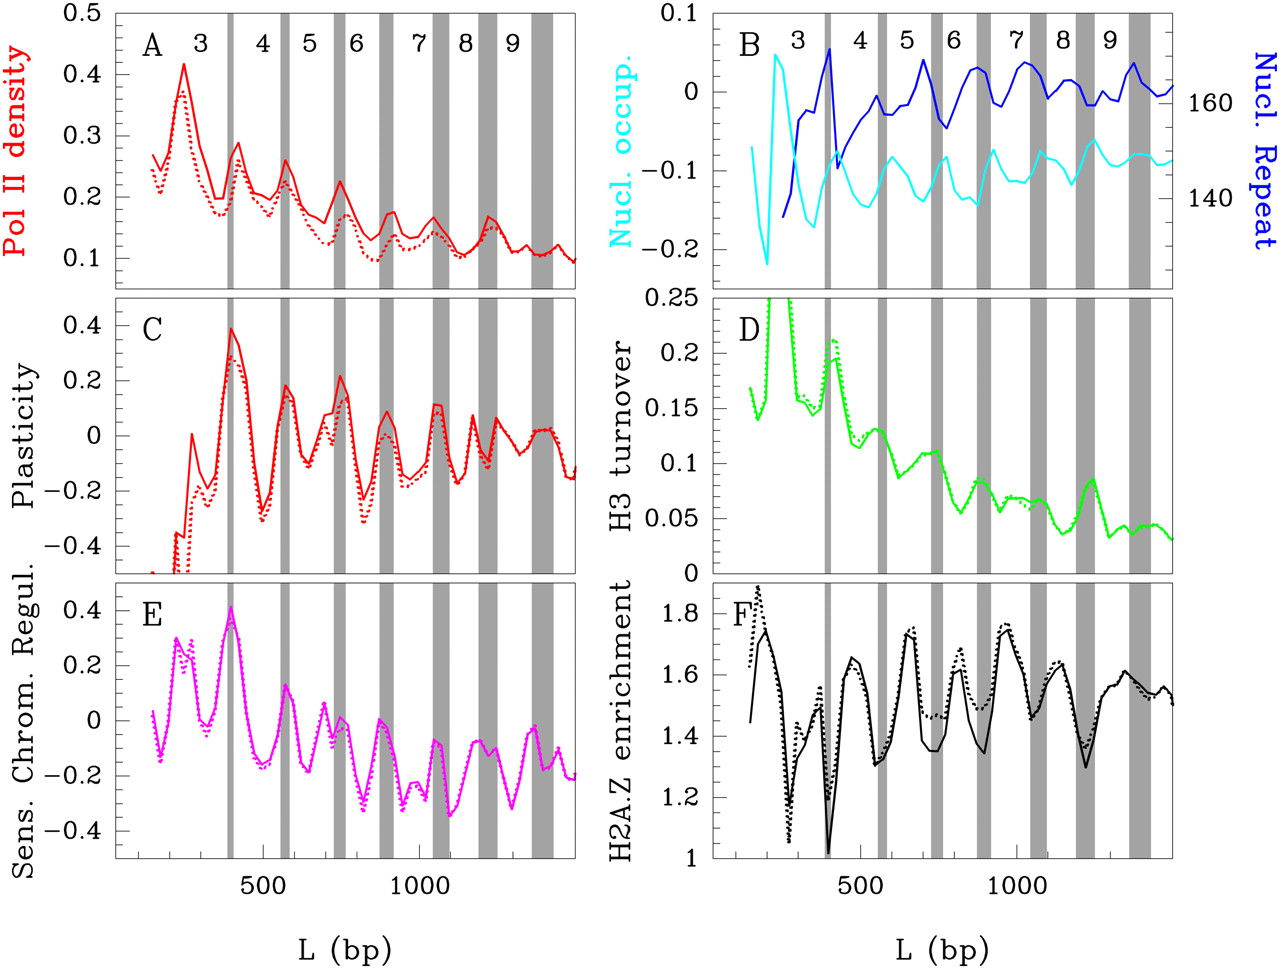
Bi-stable nucleosome organization controls gene expression. Sliding window (50 bp) analysis of average transcription rate estimated by Pol II density (Steinmetz et al. 2006) (A), nucleosome repeat length (dark-blue) and intragenic mean nucleosome occupancy (light-blue) (B), transcriptional plasticity (Tirosh and Barkai 2008) (C), H3 turnover rate (Dion et al. 2007) (D), sensitivity to chromatin regulators disruption (Steinfeld et al. 2007) (E), and H2A.Z occupancy (Zhang et al. 2005; Tirosh and Barkai 2008) (F), as a function of the distance L. The vertical gray bands define bi-stability domains. The dotted curves correspond to the results obtained when excluding the 175 (out of 4554) ribosomal protein genes from the analysis; no significant changes are observed.


