
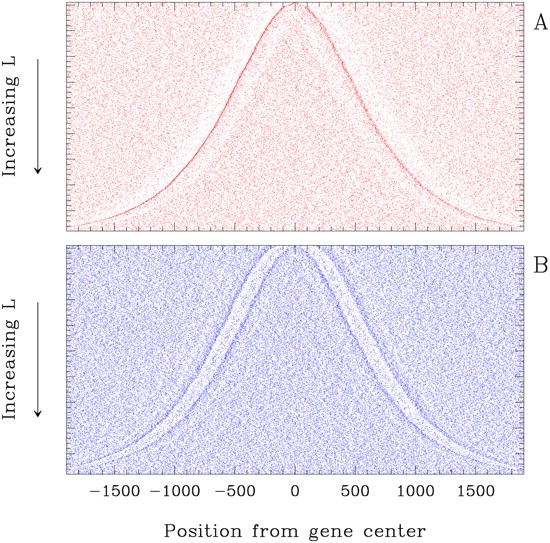
Figure 4.
2D map of nucleosome occupancy along yeast genes (same coding as in Fig. 1A). (A) In vitro data retrieved from Kaplan et al. (2009). (B) Theoretical nucleosome energy gain [−E(s)] landscape predicted by the model II (Vaillant et al. 2007).


