
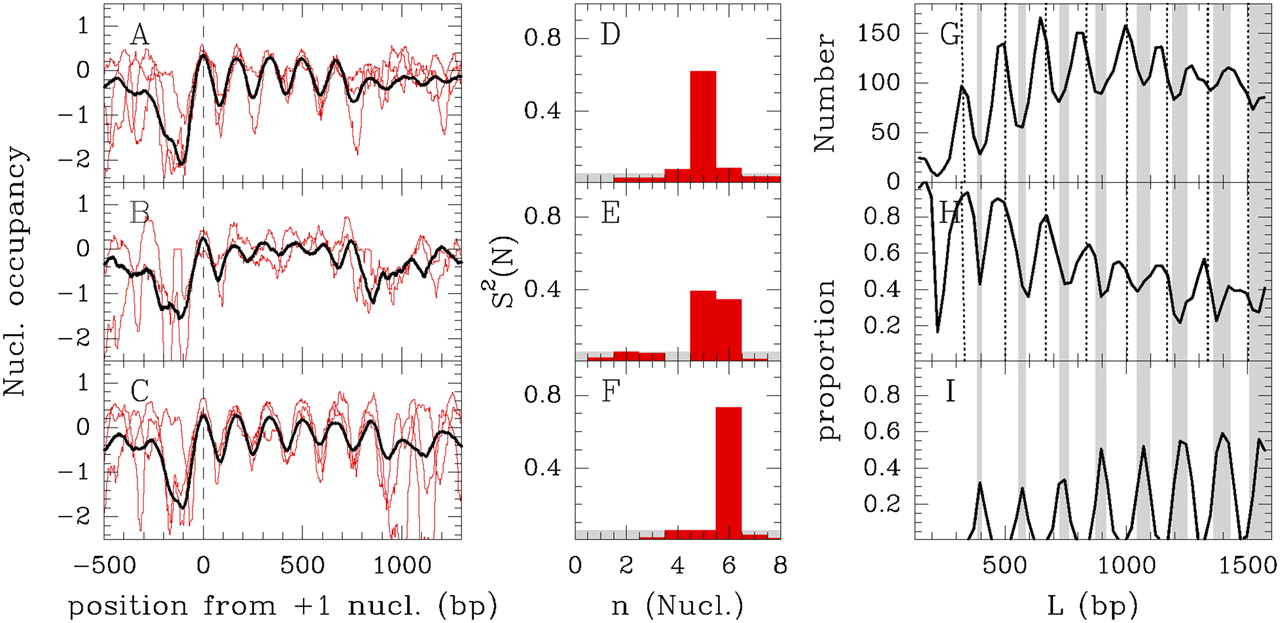
Average experimental nucleosome occupancy profiles of crystal-like and bi-stable genes (black), together with some examples of individual gene profiles (red): (A) crystal genes with n = 5 nucleosomes; (B) bi-stable genes at the transition between the n = 5 and n = 6 crystal gene domains; (C) crystal genes with n = 6 nucleosomes. Power spectrum (PS) (see Methods) of nucleosome occupancy profiles: (D) PS of one crystal gene profile with a dominant peak at n = 5 nucleosomes; (E) PS of one bi-stable gene with two main peaks of comparable magnitude at n = 5 and 6 nucleosomes; (F) PS of one crystal gene profile with a dominant peak at n = 6 nucleosomes. Total number of genes (G), proportion (density) of crystal genes (H), and proportion (density) of bi-stable genes (I) as a function of the gene size L (see Methods); the plotted data correspond to average values computed in a 50 bp sliding window. In G–I, the vertical gray bands define bi-stability domains and the vertical dotted lines indicate the successive L = n × 167, with n = 2,3,…


