
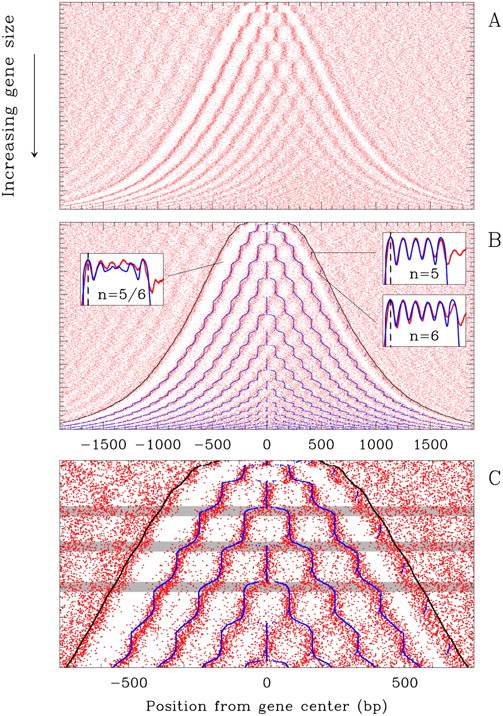
2D map of nucleosomes along yeast genes. (A) The 4554 genes are ordered vertically by the distance L between the NFRs first (5′) and last (3′) nucleosomes. The nucleosome occupancy profile of each gene is figured along a horizontal line: red dots correspond to the minima of nucleosome occupancy; nucleosomes occupy the white zones; in vivo data are retrieved from (Lee et al. 2007). (B) Predictions of our physical modeling (blue) are drawn on top of experimental data (red). (Insets) Mean experimental (red) and theoretical (blue) nucleosome occupancy profiles for crystal genes harboring 5 nucleosomes (right, top), 6 nucleosomes (right, bottom), and for bi-stable genes with 5/6 nucleosomes (left). (C) Zoom on the first 2000 genes in B; gray-shaded areas correspond to some bi-stable L -domains. In B and C, the black curves indicate the 5′ - and 3′ -end positions of the theoretical excluding nucleosome energy barriers.


