
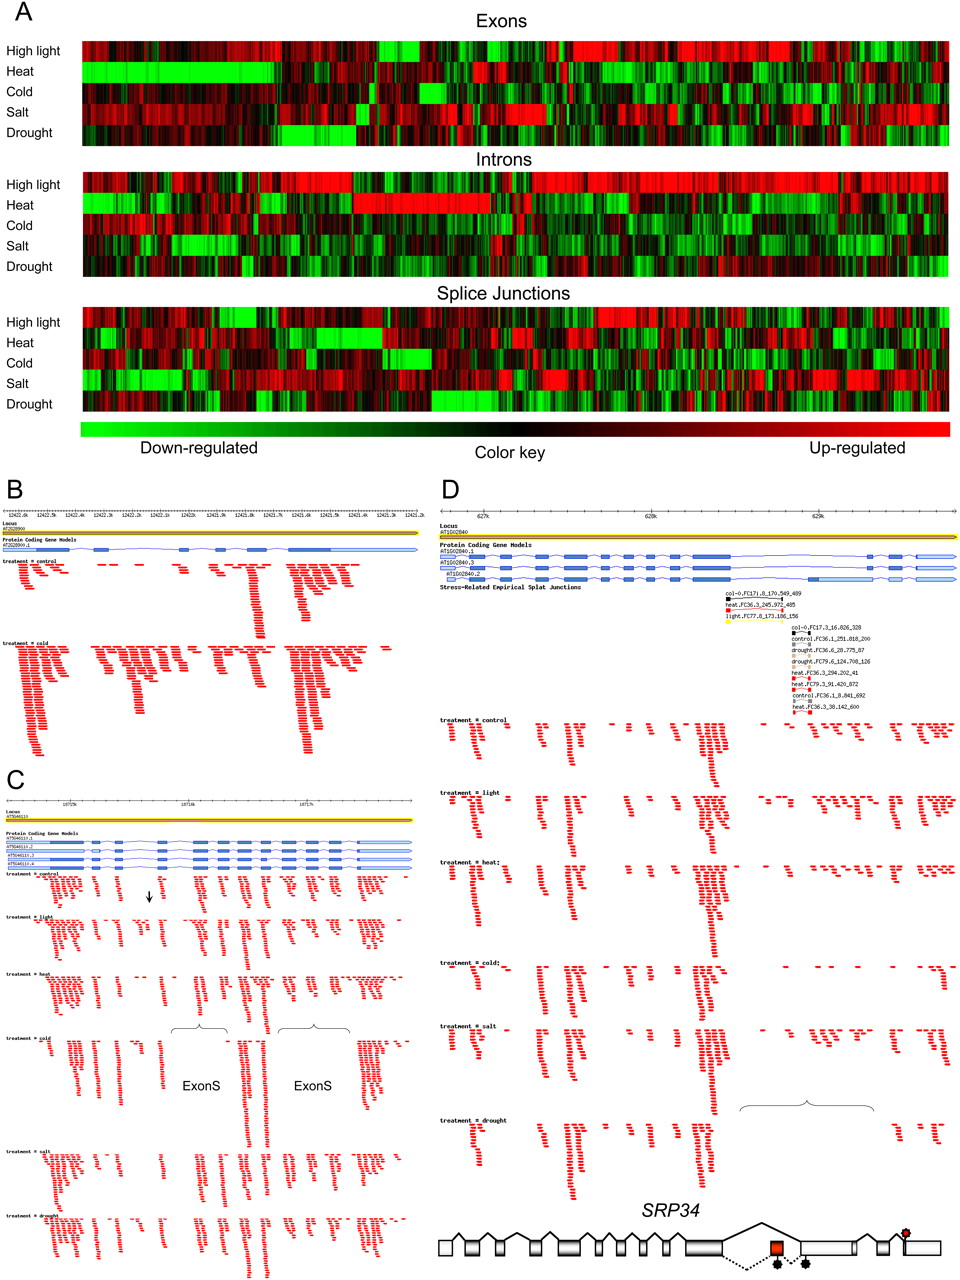
Identification of stress-associated alternative splicing. (A) Exons, introns, and splice junctions were identified by the changes in expression levels (i.e., by the normalized number of the RNA-seq microreads encompassing each feature) under different abiotic stress conditions relative to untreated control. The “Exons” panel represents 807 differentially expressed exons; change in expression level ranged from −30- to +82-fold normalized to untreated control. The “Introns” panel represents 1230 differentially expressed introns with expression changes ranging from −54- to +263-fold. The “Splice Junctions” panel features 1093 exon–exon splice junctions (with changes in normalized expression from −22- to +46-fold). Gene clusters were computed by the default settings of heatmap.2 in the R “gplots” package as described in the Methods. Up- and down-regulated features are shown in red and green, respectively; black corresponds to no change relative to the untreated control. (B) Cold-induced intron retention (bracketed) in the OUTER ENVELOPE PROTEIN 16 (AT2G28900) transcript. Changes in microread density coverage are indicated by a horizontal bracket. (C) Stress-regulated exon skipping (brackets) and cassette exon (arrow) events in the ACCLIMATION OF PHOTOTSYNTHESIS TO ENVIRONMENT 2 (AT5G46110) transcript. (D) Detection and validation of novel SJs in transcripts of splicing factor SRP34 (AT1G02840). SJs corresponding to the untreated control, high light, heat, and dehydration treatments are shown in gray, yellow, red, and brown, respectively. Position of alternatively spliced intron 10 is bracketed. A previously undetected splice isoform containing a poison cassette exon (red rectangle) is illustrated in the bottom panel. Locations of reference and premature termination codons are indicated by red (top) and black (bottom) stars, respectively.


