
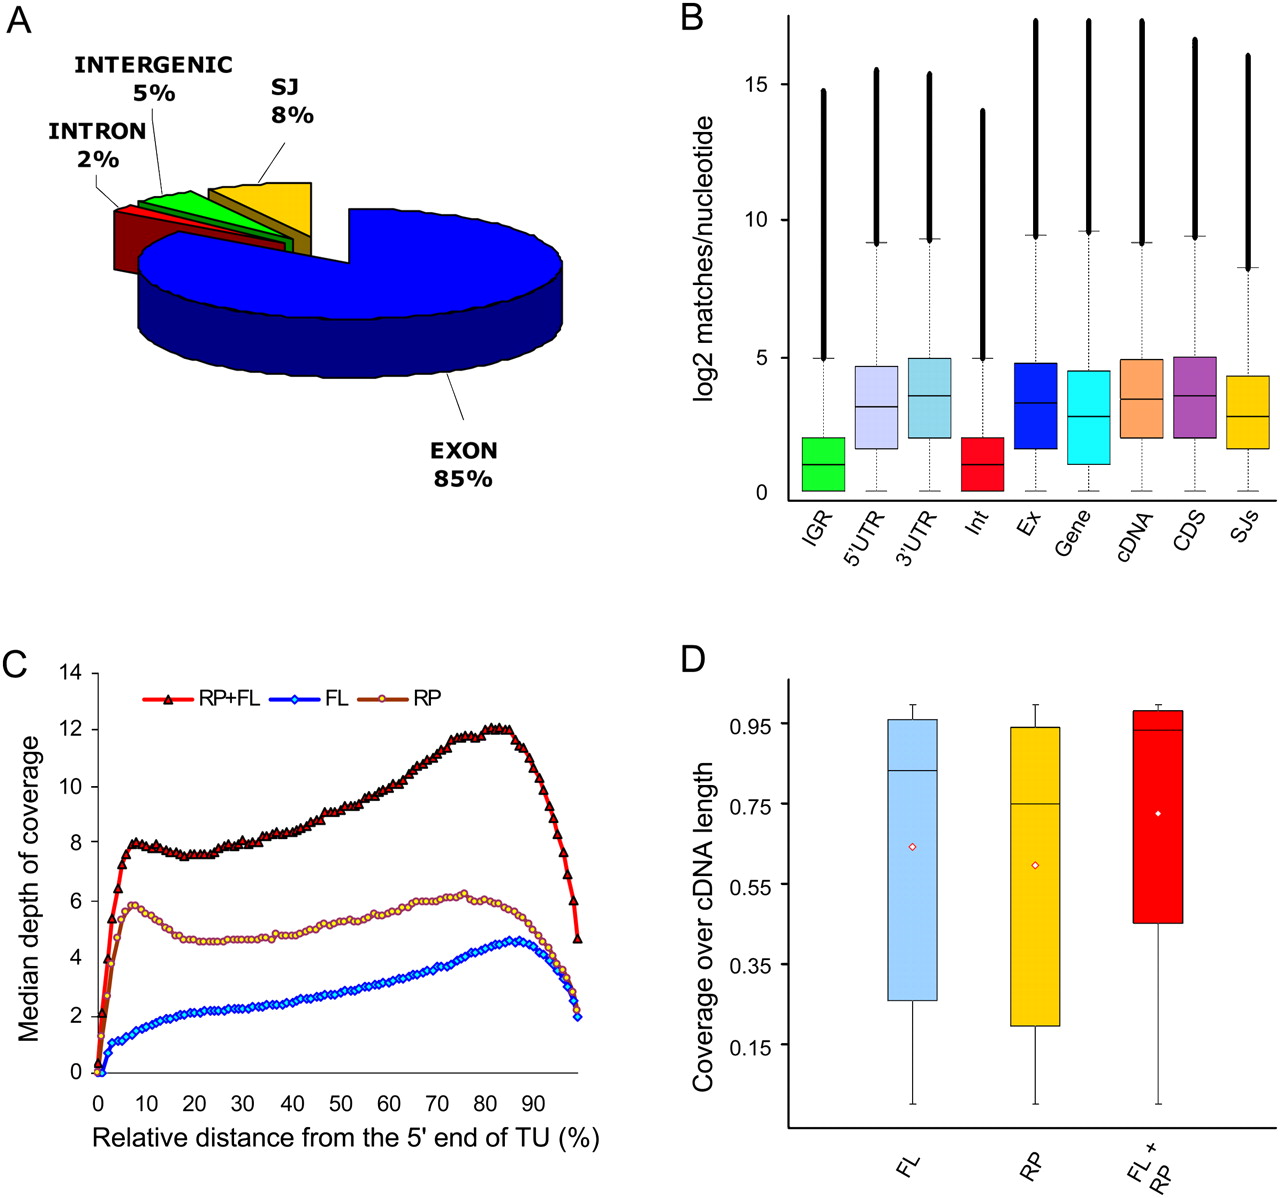
Depth and coverage of annotated gene features. (A) Distribution of the RNA-seq microreads along annotated Arabidopsis annotated genomic features. Among reads perfectly matching the Arabidopsis genome, there were 71.3 million matches to annotated exons, 6.7 million matches to annotated splice junctions, 4.4 million matches to annotated intergenic regions, and 1.4 million matches to annotated introns. Of the remaining 187 million reads, ∼20% matched the Arabidopsis genome allowing for up to two mismatches and the remaining ∼50% aligned with more than two mismatches or did not match at all. (B) Box-and-whisker plots of log2-transformed numbers of microread matches at each nucleotide position for TAIR annotated intergenic regions (IGR), 5′ untranslated regions (5′UTR), 3′ untranslated regions (3′UTR), introns (Int), exons (Ex), genes (Gene), cDNAs (cDNA), coding sequences (CDS), and splice junctions (SJs). The bottom and top of the box represent the 25th and 75th quartiles, respectively, and the middle line is the median. Black filled circles show outliers. (C) Distribution of the RNA-seq microread coverage along the length of the transcriptional unit. The median depth of coverage along the length of each individual cDNA was calculated as described in the Supplemental Material and plotted against the relative length of the transcriptional unit (cDNA) for full-length enriched oligo(dT)-primed libraries (blue diamonds) and randomly primed libraries (yellow circles). The combined data from the two libraries are depicted by red triangles. (D) Coverage over the length of TAIR8 annotated cDNAs. Perfect match 32-mer Illumina reads were mapped to the TAIR8 annotated cDNAs for nuclear genes using HashMatch (http://mocklerlab-tools.cgrb.oregonstate.edu/). Illumina read coverage along the predicted sequence features was calculated using a Perl script. Box-and-whisker plots depict the Illumina coverage calculated as the percentage of bases along the length of the cDNA sequence that was supported by Illumina reads from the FL, RP, and combined FL + RP data sets. The bottom and top of the box represent the 25th and 75th quartiles, respectively. The black line is the median and the red diamonds are the mean.


