
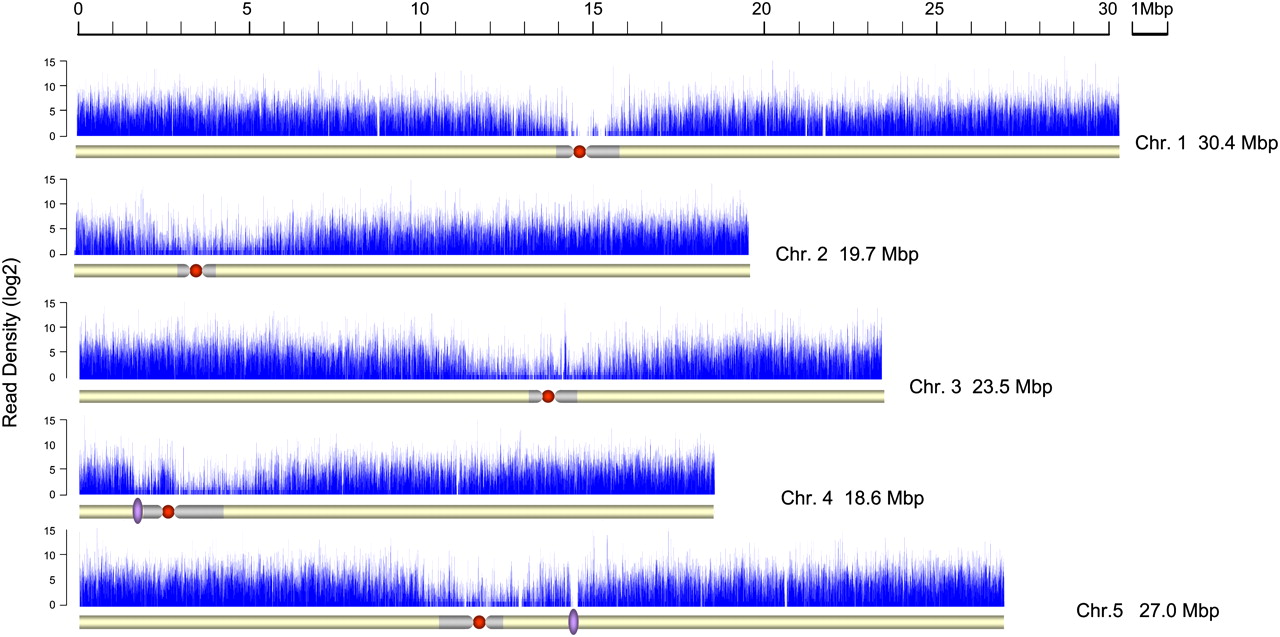
Transcription profile of the A. thaliana genome. Distribution of RNA-seq microread density along chromosome length is shown. Each vertical blue bar represents log2 of the frequency of unique single-copy cDNA-derived microreads plotted against chromosome coordinates. A schematic drawing of the chromosome and its features is shown below the microread density. Approximate boundaries of Arabidopsis centromeres (Kotani et al. 1999; The Arabidopsis Genome Initiative 2000; Tabata et al. 2000; Kumekawa et al. 2001; Copenhaver 2003) are depicted in gray. Red circles indicate unsequenced centromeric gaps. Heterochromatic knobs are denoted by violet ellipses. Chromosome portions corresponding to the telomeres and nucleolar organizing regions are not shown.


