
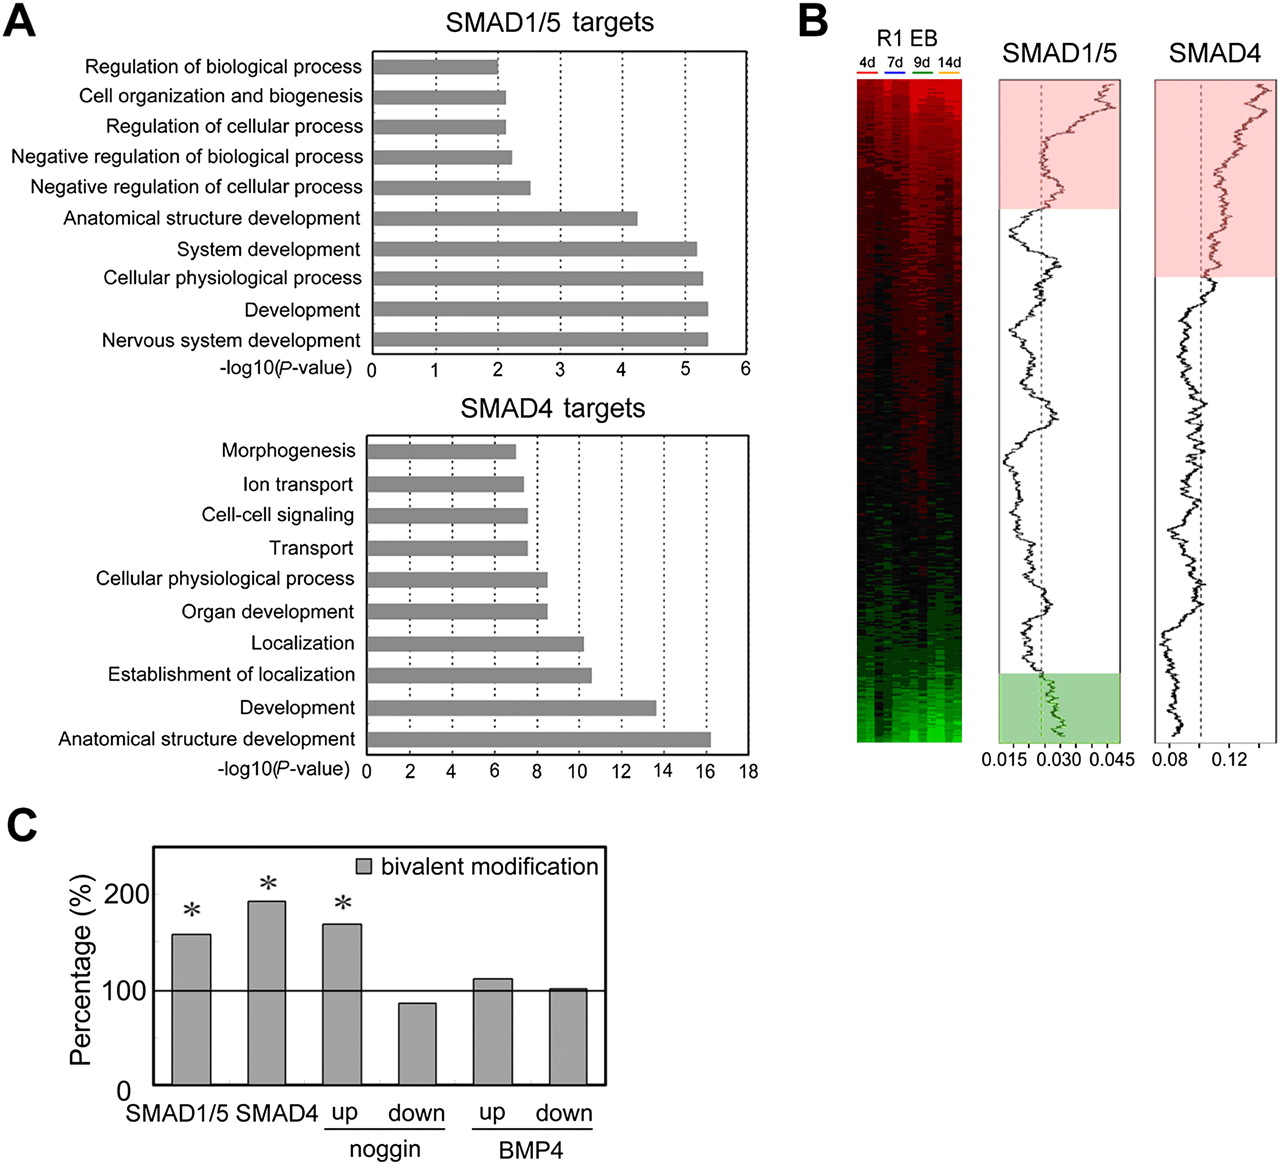
Developmental regulators are enriched in the SMAD-associated genes. (A) GO analysis of SMAD-associated genes. The y-axis shows the GO terms, and the x-axis shows the enrichment significance P-values for the top 10 enriched GO terms. (B) Genome-wide analysis of SMAD1/5 and SMAD4 targets during EB differentiation. The expression profile data are from Hailesellasse Sene et al. (2007). Genes are rank-ordered by the degree of induction (red) and repression (green) relative to undifferentiated ES cells (left). The two plots (middle and right) show moving average of the frequency of probes for genes that have SMAD-binding sites in a 2000-probe sliding window. The pink and light-green shaded areas indicate the genes whose SMAD-binding frequency is higher than the background level. The dashed line indicates the expected average (background level or the ratio of the number of probes for SMAD targets over the total number of interrogated gene probes). (C) Percentage of SMAD-bound genes, BMP4- and noggin-regulated genes that contain both H3K4me3 and H3K27me3 bivalent modifications were compared to that over all promoters. Asterisk indicates Fisher's exact test P < 0.001. Proportion test also showed similar results (data not shown).


