
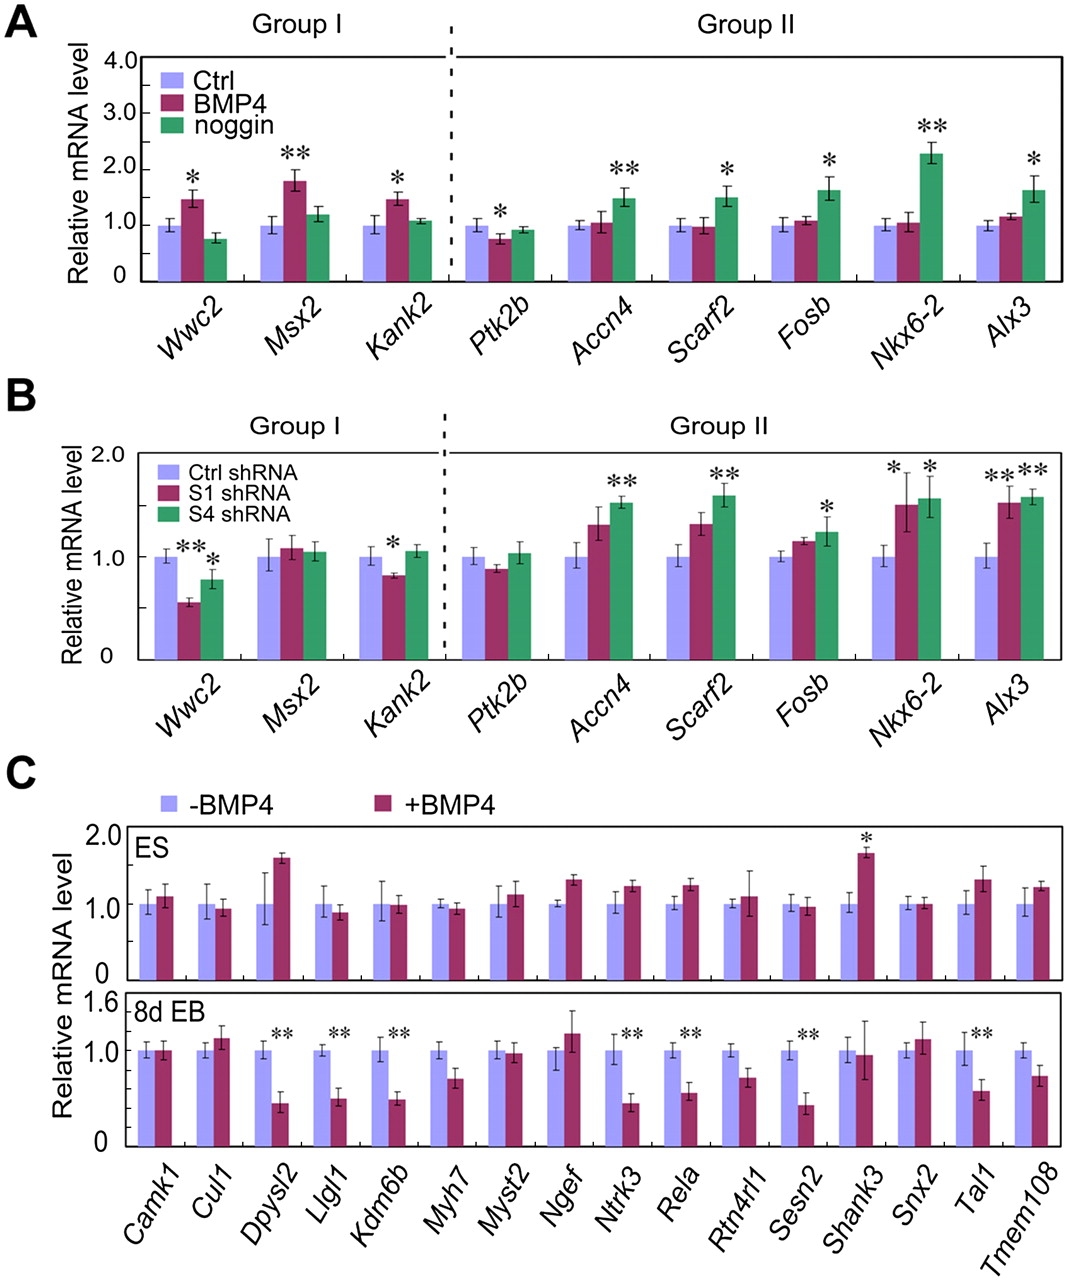
Expression analysis of SMAD-associated genes. (A) Validation of genes expression change upon ligand stimulation. Group I includes genes that are up-regulated in BMP4 and/or down-regulated in noggin according to microarray analysis and genes in Group II are oppositely regulated. (B) Gene expression in Smad1 and Smad4 knockdown ES cells. (C) SMAD-associated genes are regulated in ES cells and EB upon BMP4 treatment. ES cells and 8-d EB were treated with 20 ng/mL BMP4 for 4 h. Total RNA was extracted and gene expression was analyzed by qRT-PCR. The significance of expression was analyzed by Student's t-test and data are presented as mean ± SEM (n = 3; **P < 0.01; *P < 0.05).


