
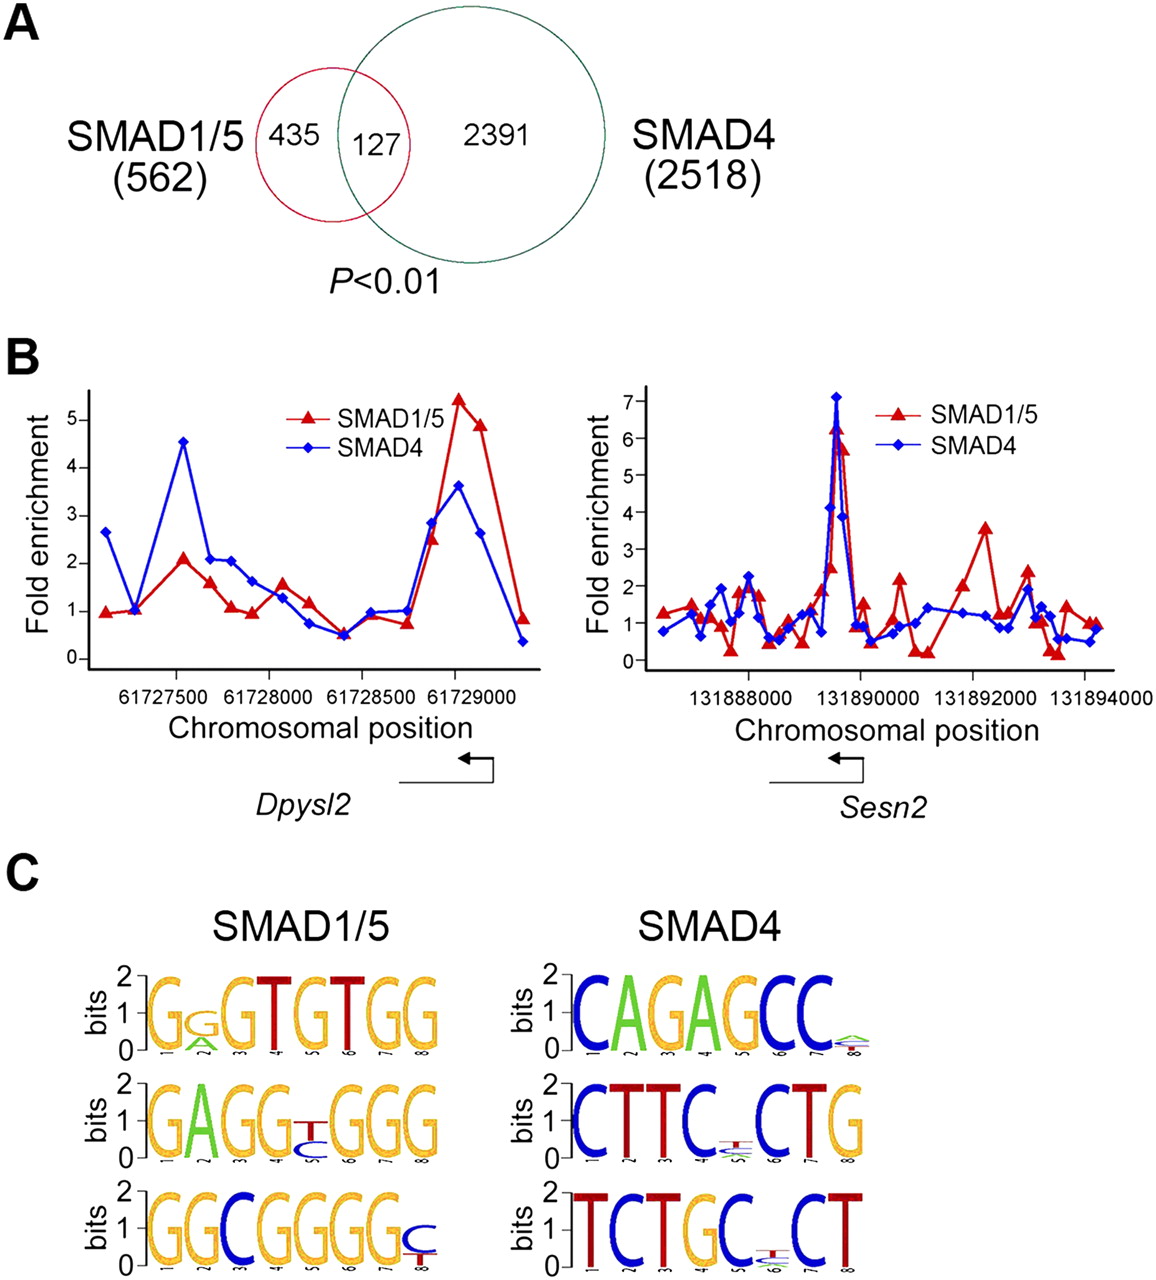
Co-occupancy of SMAD1/5 and SMAD4 in a subset of genes and de novo prediction of SMAD DNA-binding motifs. (A) A Venn diagram showing the overlap among genes bound by SMAD1/5 and SMAD4. Numbers in parentheses are total numbers of genes associated by respective SMAD. (B) A representative view of co-occupancy by two SMADs. Plots display unprocessed ChIP-enriched ratios within the chromosomal region indicated in the x-axis. The corresponding gene is depicted below the plot, and the TSS and transcriptional direction are denoted by arrows. (C) De novo prediction of SMAD-interacting DNA motifs within SMAD-binding sites obtained by DME with default parameters. Three representative motifs are shown here.


