
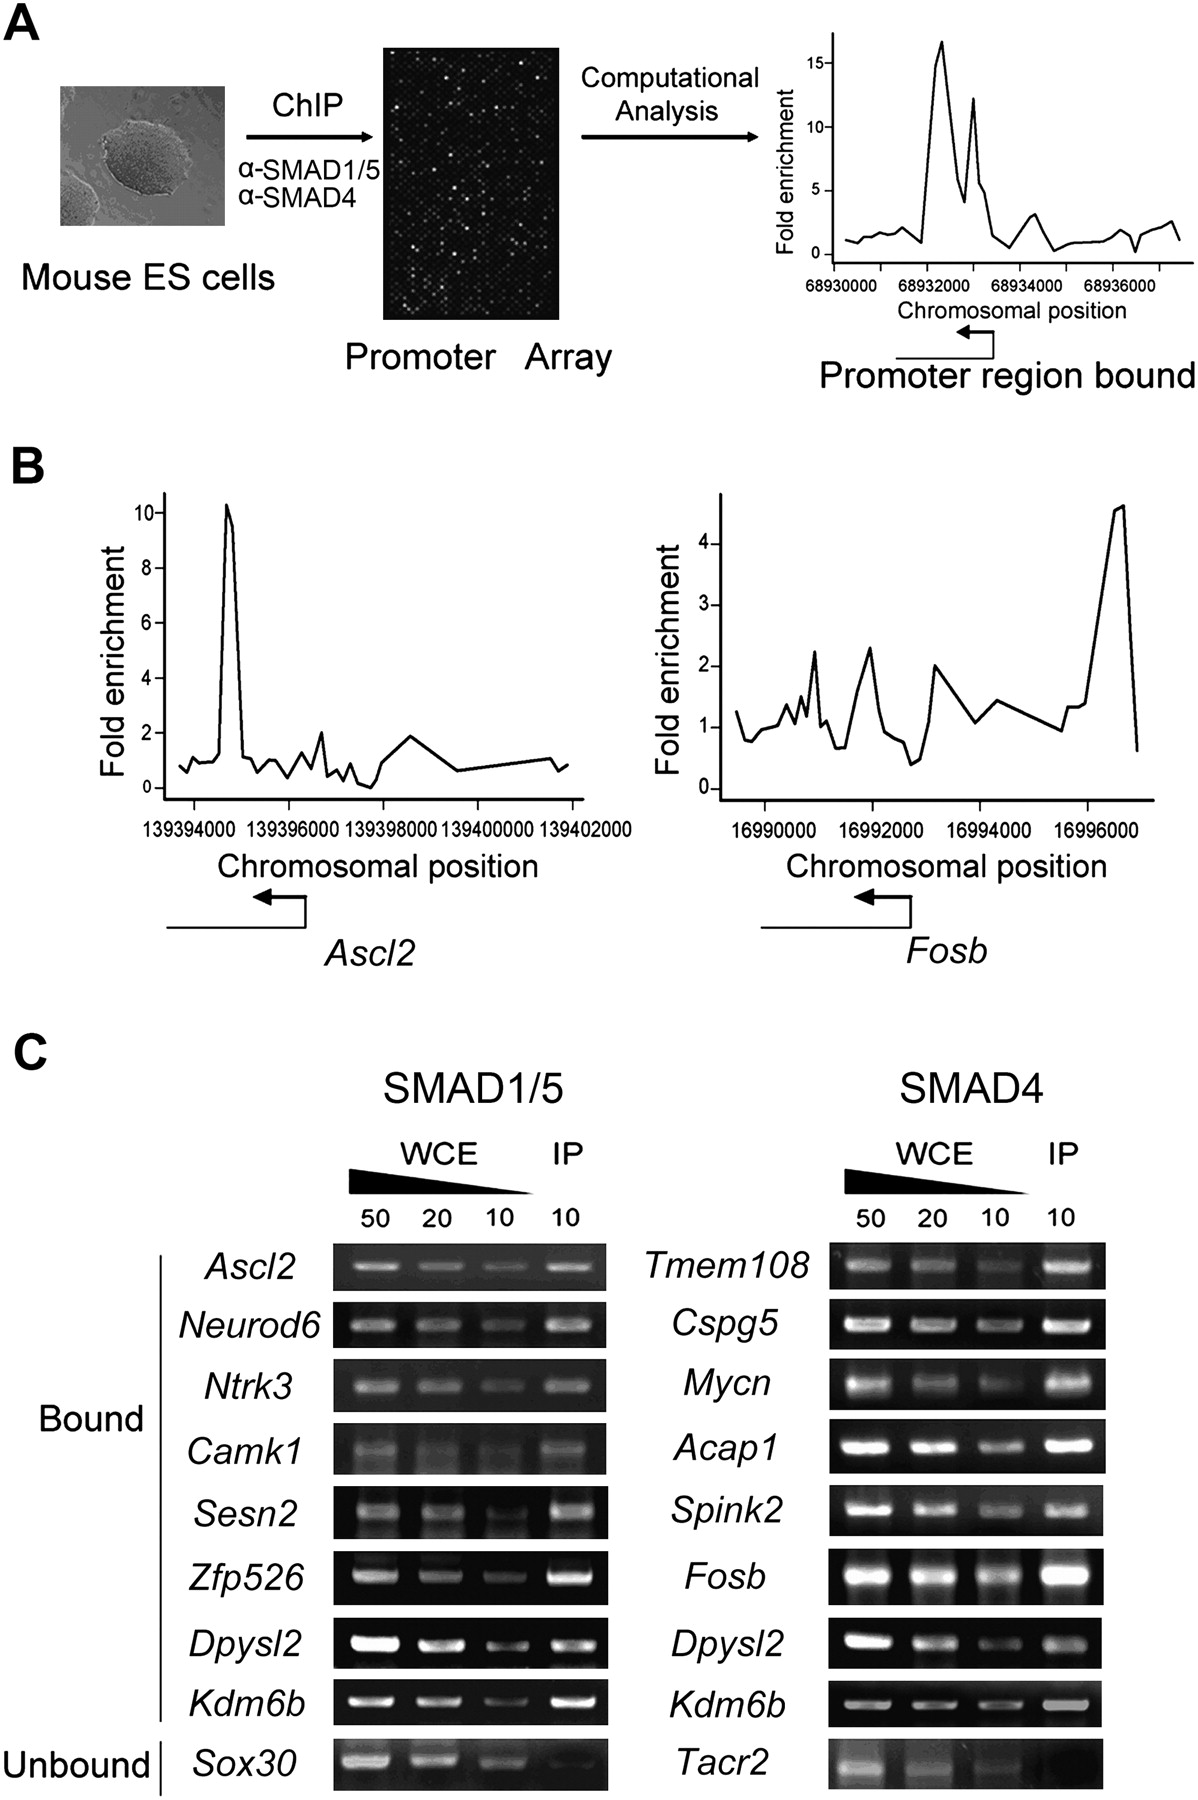
Genome-wide analysis of SMAD1/5- and SMAD4-binding sites in R1 ES cells. (A) Strategy of mapping SMAD1/5- and SMAD4-binding sites in the genome of R1 cells. (B) A representative view of SMAD-bound regions. Plots display ChIP-enriched ratios or the signal intensity ratio of the immunoprecipitated DNA (IP)/whole cell extract (WCE) DNA within the chromosomal region indicated by the x-axis. The corresponding gene is depicted below the plot, and the transcriptional start sites (TSS) and transcriptional directions are denoted by arrows. (C) Representative results of confirmation of SMAD binding to DNA by ChIP-site specific PCR. Immuno-enriched (anti-SMAD IP) DNA (10 ng) from R1 cells and a range of unenriched WCE DNA amounts (10, 20, 50 ng of DNA) are used for each primer pair which is designed according to the predicted bound regions.


