
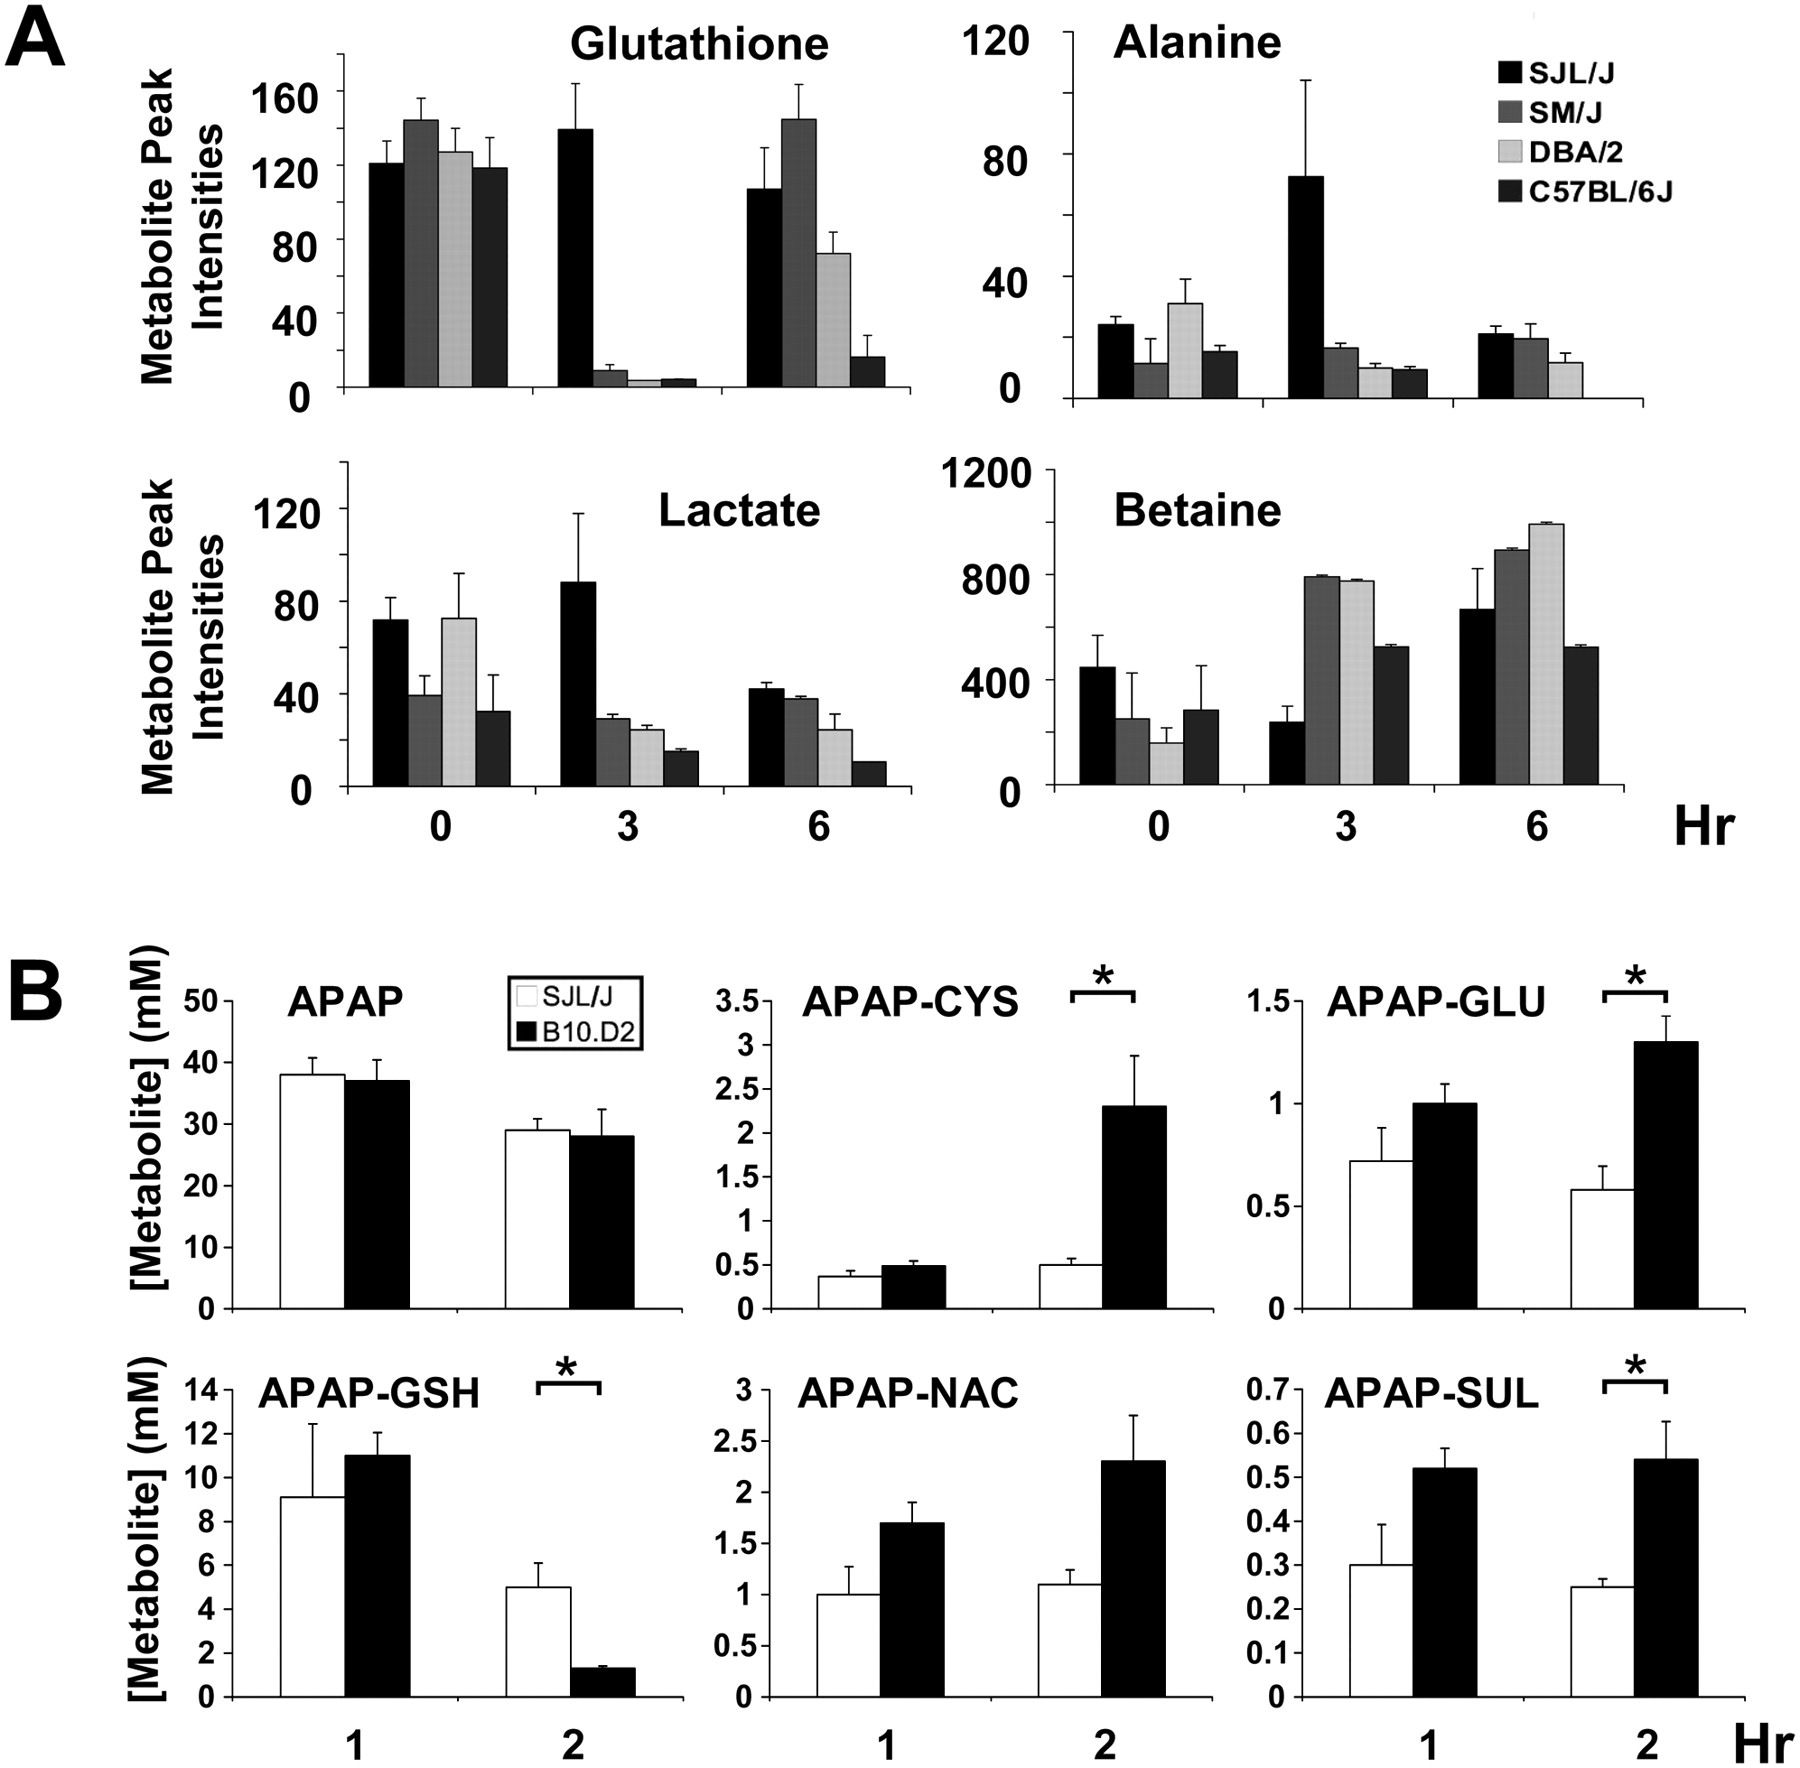
Metabolomic and pharmacokinetic analyses. (A) The abundance of 400 individual metabolite peaks in liver tissue obtained from four strains at 0, 3, and 6 h after APAP exposure was quantitatively analyzed by 2D NMR. At 3 h, the abundance of GSH, alanine, lactate, and betaine exhibited a unique pattern in the resistant SJL/J mice, which differed from that in the three sensitive strains (DBA/2J, C57BL/6J, and SM/J). Each bar represents the average ± SD (N = 3). (B) The amount of acetaminophen (APAP) and its metabolites in bile obtained from SJL/J or B10.D2 mice at 1 and 2 h after 300 mg/kg i.p. APAP was measured by LC/MS/MS analysis. Each bar represents the average ± SE (N = 4–5) at the indicated time points, and asterisks (*) denote significant differences (P < 0.05) between two strains. Of note, there were no significant differences in APAP or any APAP-metabolite concentrations in bile at 1 h; but there were significant differences in the concentration of several metabolites at 2 h after drug exposure. At that time, B10.D2 mice had fourfold lower APAP-GSH concentration than SJL/J mice, while there was a compensatory approximately fivefold increase in the concentration of the APAP-cysteine conjugate in B10.D2 mice relative to that in SJL/J mice. CYS, cysteine; GLU, glucoronate; NAC, N-acetylcysteine; and SUL, sulfate.


