
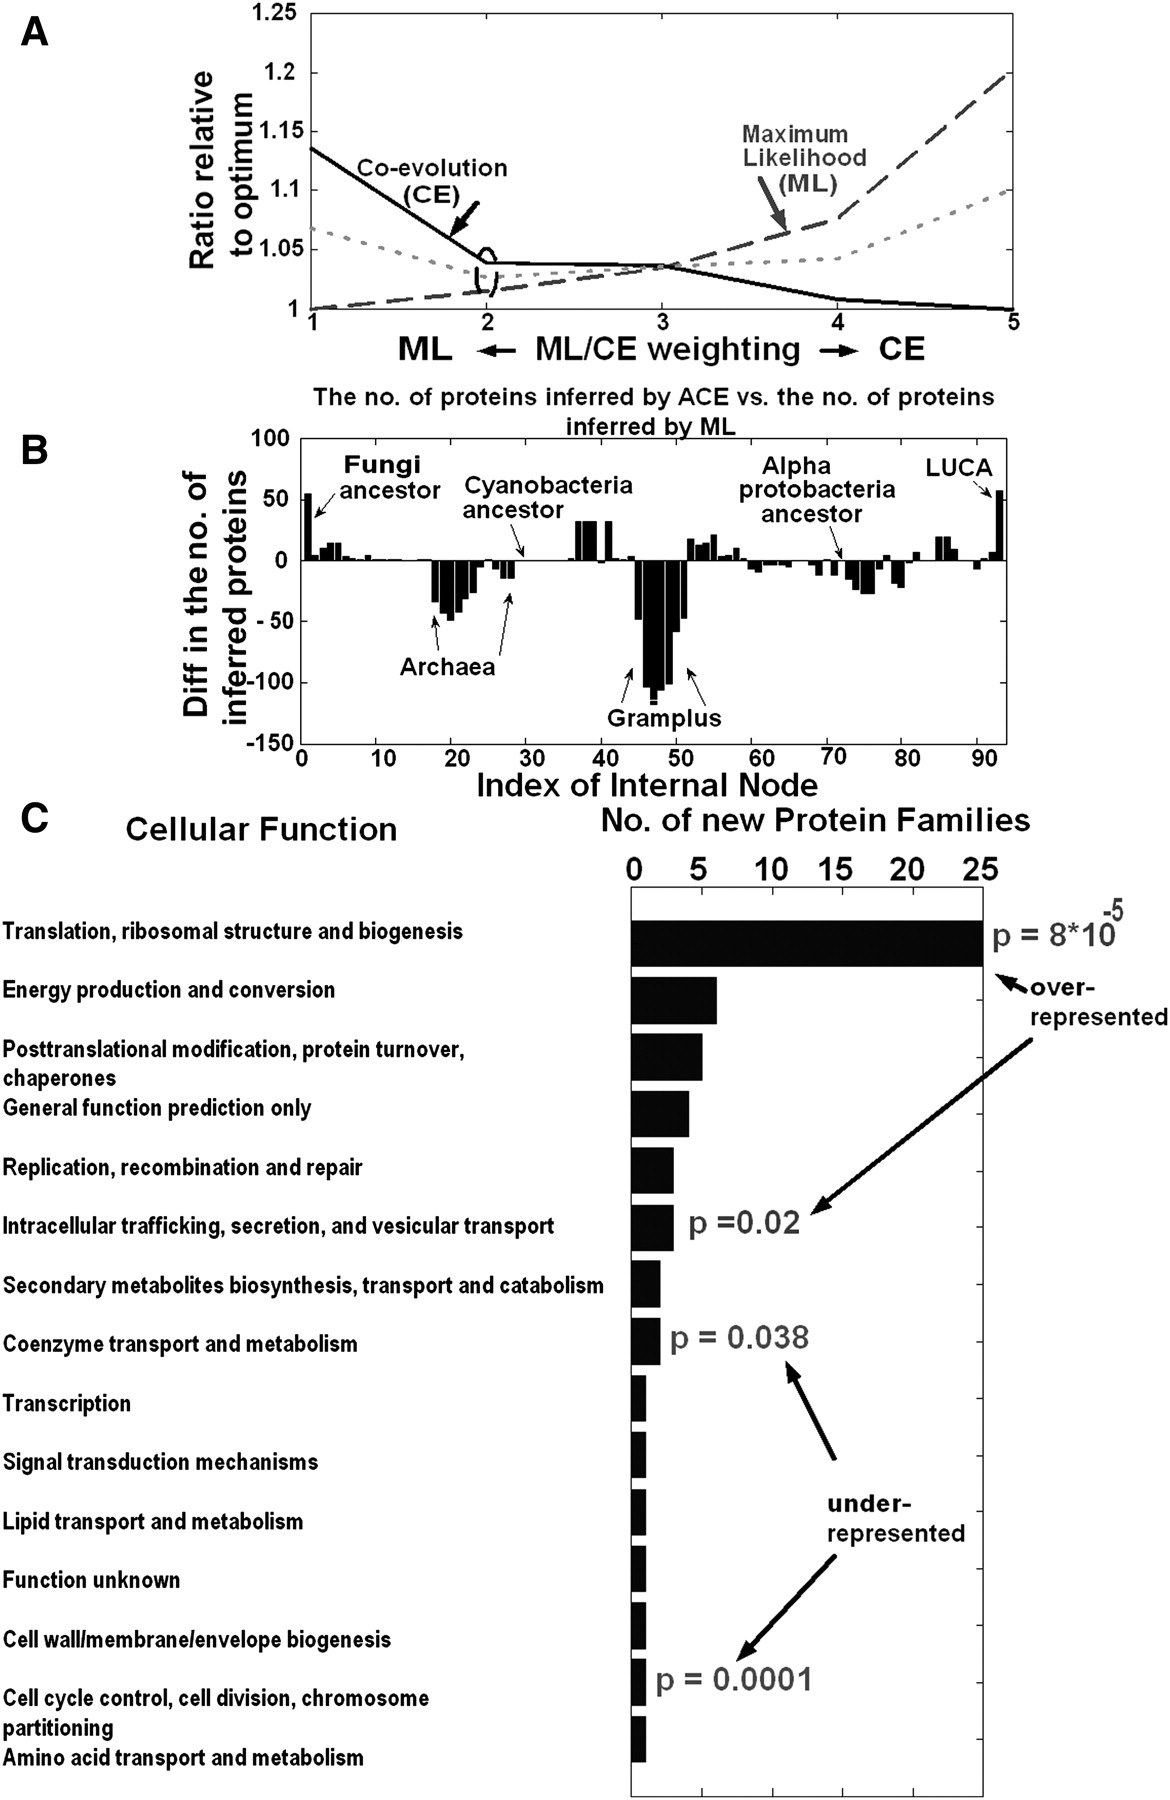
(A) The coevolutionary score (solid line), the maximum likelihood score (long-dashed line), and their mean (short-dashed line) for different ML/CE weightings. In all of the ML/CE weightings the two scores are <120% higher than their optimum/minimum. The second ML/CE weighting optimizes the mean of these two scores (see short-dashed line). (B) The difference between the number of proteins inferred by ACE and the number of proteins inferred by maximum likelihood for each internal node, using the optimal weighting. (C) The function of the protein families inferred by ACE and not by ML in LUCA. Gene families whose function is related to translation or intracellular trafficking are overrepresented in this set (hypergeometric P-values = 8 × 10⁻⁵ and 0.02, respectively; Methods); gene families whose function is related to amino acid transport and metabolism and transcription are underrepresented in this set (hypergeometric P-value = 0.0001 and 0.038, respectively; Methods).


