
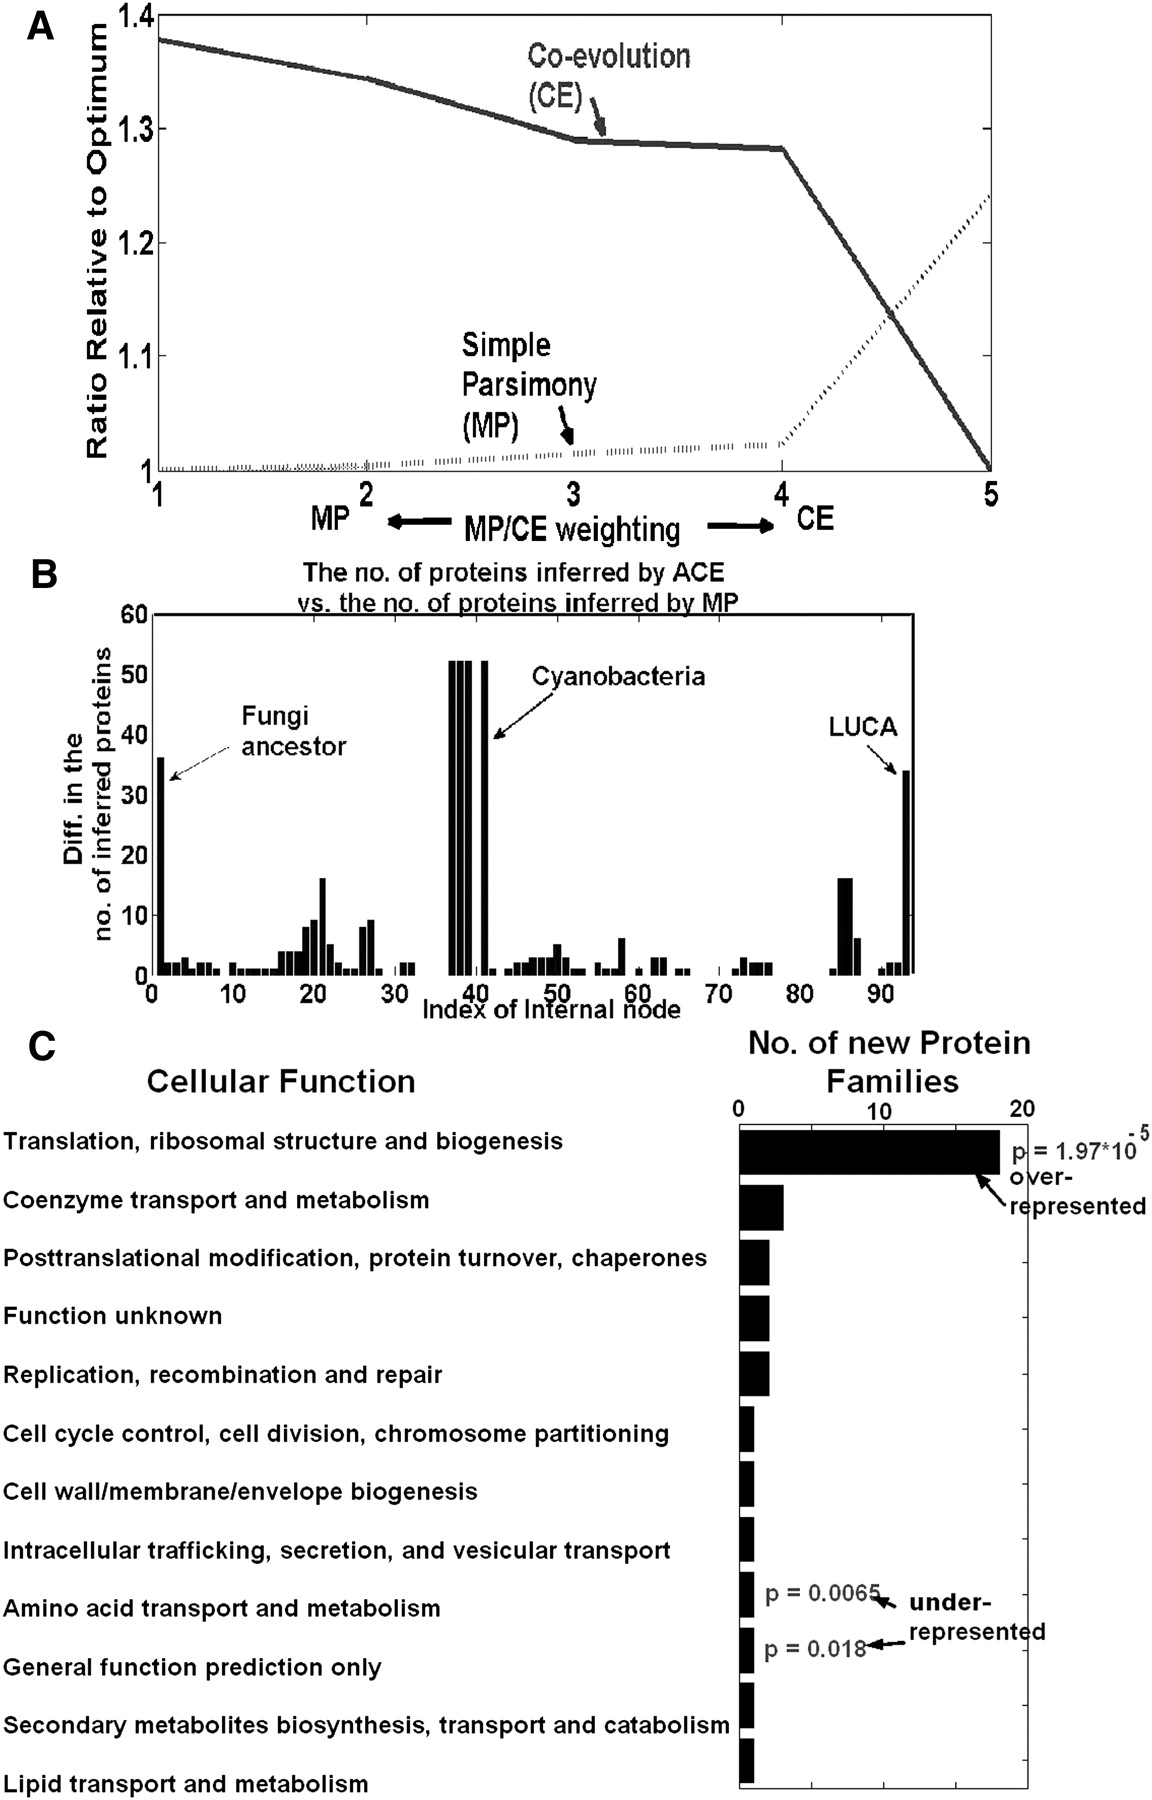
(A) The coevolutionary score (dashed), the simple maximum parsimony score (continuous) for different MP/CE weightings. The scores are normalized to the minimal solution (i.e., “1” denotes a minimal/optimal solution): By definition, at the first MP/CE weighting, the simple parsimony score is optimal/minimal, while at the fifth MP/CE weighting the coevolutionary score is optimal/minimal. (B) The difference between the number of proteins that ACE inferred (using the first MP/CE weighting) and the number of proteins inferred by simple MP for each internal node. (C) The function of the protein families inferred by ACE and not by MP in LUCA. Gene families whose function is related to translation are overrepresented in this set (hypergeometric P-value = 1.97 × 10⁻⁵; Methods); gene families whose function is related to amino acid transport and methabolism are underrepresented in this set (hypergeometric P-value = 0.0065; Methods).


