
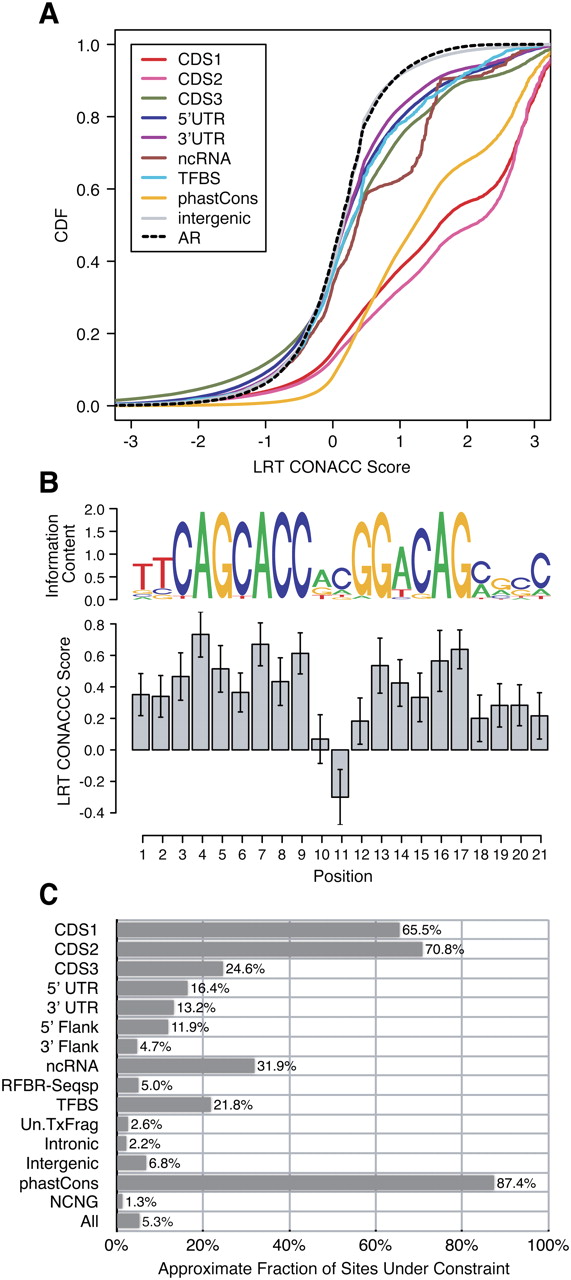
Distributions of all-branch scores. (A) Cumulative distribution functions (CDFs) for phyloP scores in sites of different annotation classes, based on the LRT method and 36-species multiple alignments for the ENCODE regions. Positive scores indicate conservation, and negative scores indicate acceleration (CONACC mode) (see Methods). Curves are shown for first, second, and third codon positions (CDS1, CDS2, CDS3), 5′ and 3′ UTRs, noncoding RNAs (ncRNAs), predicted transcription factor binding sites (TFBS), conserved elements identified by phastCons, intergenic sites, and ancestral repeats (AR). (See Supplemental Fig. S6 for additional annotation classes.) (B) Average conservation scores as a function of genomic position within 52 predicted NRSF binding sites in the ENCODE regions. Binding sites were predicted at ChIP/chip peaks using the motif from TRANSFAC (FDR = 20%) (Supplemental section S2.9). A sequence logo representation of the motif is shown for comparison. Notice the general correlation between information content and cross-species conservation across the positions of the motif (see Moses et al. 2003). (C) Estimated fractions of sites under selection for each annotation class. Classes include those from A, plus 5′ and 3′ flanking regions of genes, sequence-specific regulatory binding regions (RFBR-Seqsp), putative transcriptional fragments of unknown function (Un.TxFrags), intronic sites, and nonconserved nongenic (NCNG) sites. These are estimates of lower bounds computed by a simple mixture-decomposition method (see Methods) and should be considered approximate. All classes show a highly significant enrichment for conserved sites relative to the AR distribution by a one-sided Mann-Whitney U test (P ≈ 0) except the 3′ flank, intronic, Un.TxFrags, and NCNG categories (all P ≈ 1).


