
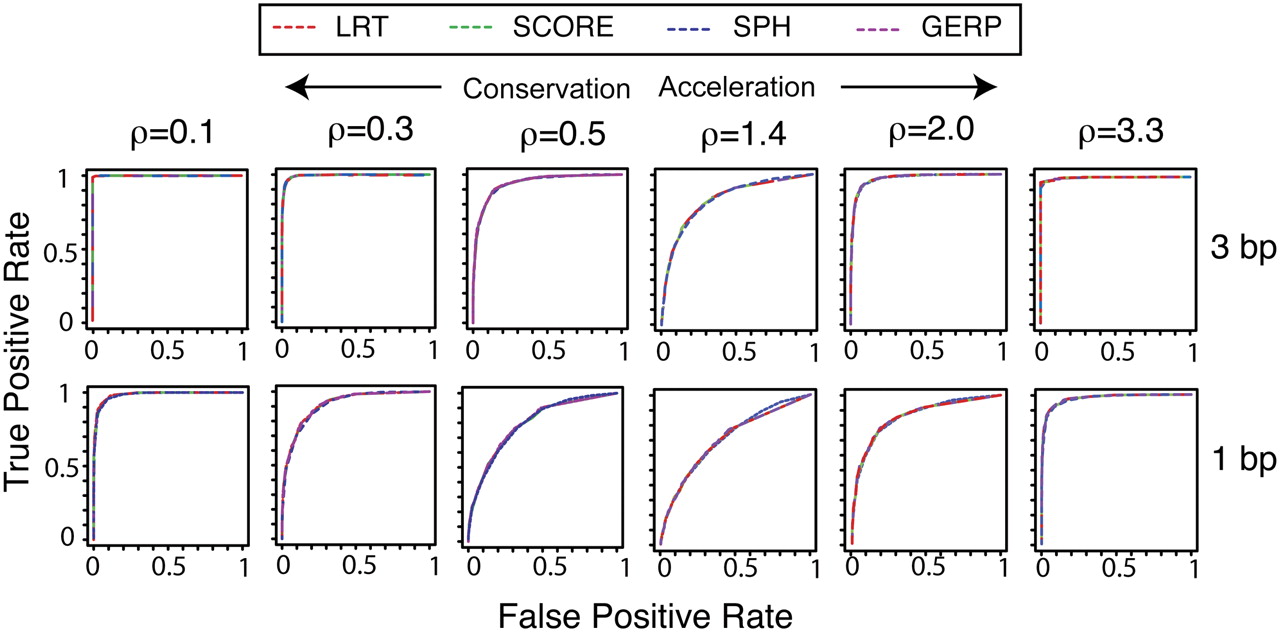
Figure 1.
Receiver operating characteristic (ROC) curves showing false-positive versus true-positive rates for the all-branch tests implemented in phyloP: (red) LRT, (green) SCORE, (blue) SPH, and (purple) GERP. Individual plots show results for simulated data sets with either 3-bp (top) or 1-bp (bottom) elements generated from models with a range of deviations ρ from the neutral rate ρ = 1.0 (columns).


