
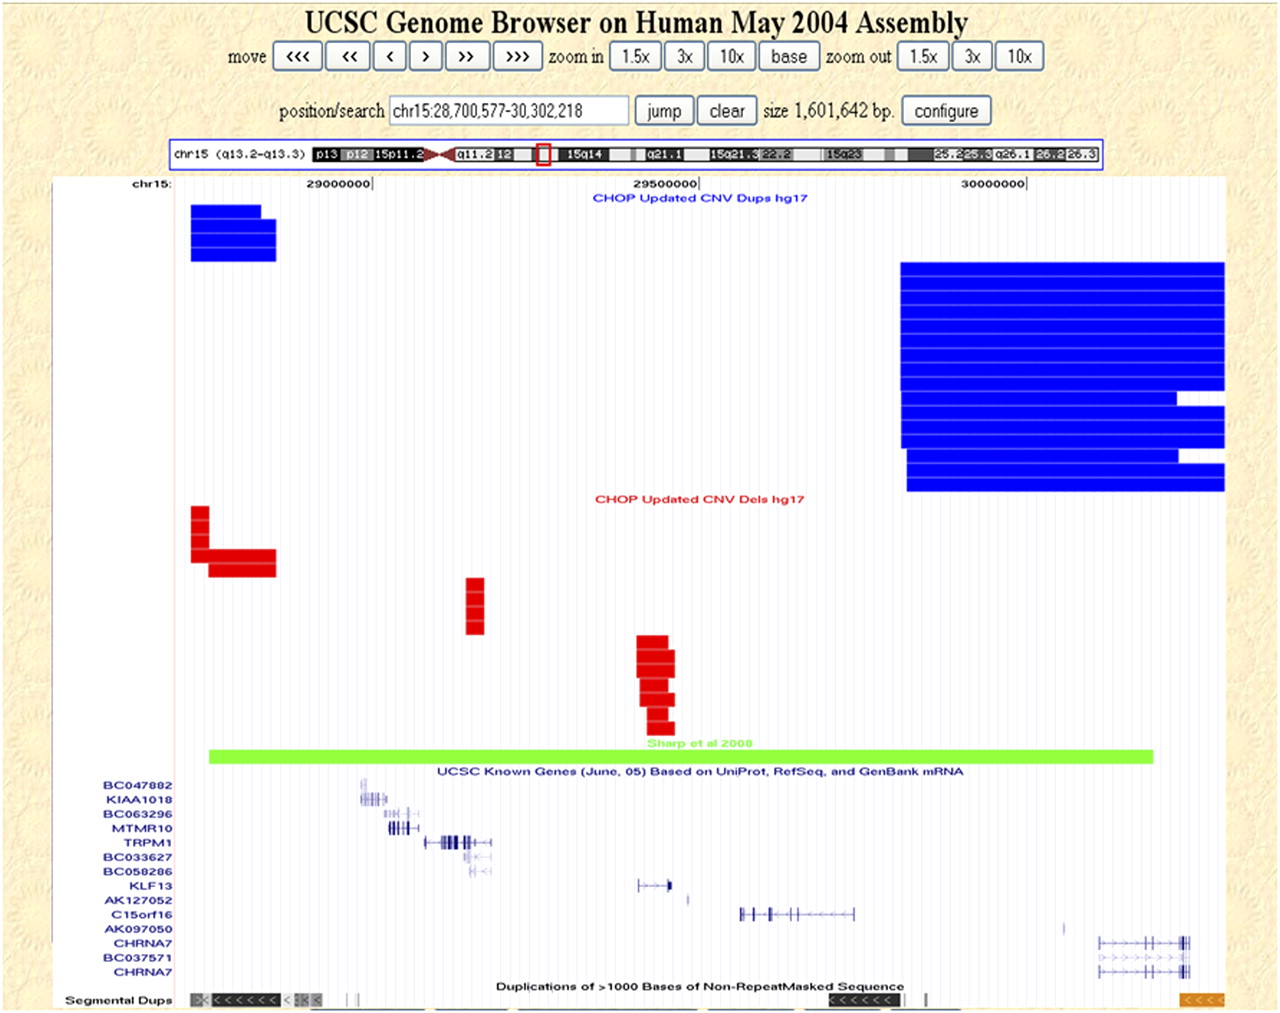
Figure 3.
Copy number variation within 15q13.3. Nonunique CNVs detected in our control data set that map within 15q13.3 (chr15:28,700,577–30,302,218, hg17, NCBI build 35) are shown as custom tracks within the UCSC Genome Browser (http://genome.ucsc.edu/). (Red rectangles) Deletions; (blue rectangles) duplications; (green rectangle) the CNV reported by Sharp et al. (2008). The UCSC known genes and segmental duplication tracks are also shown.


