
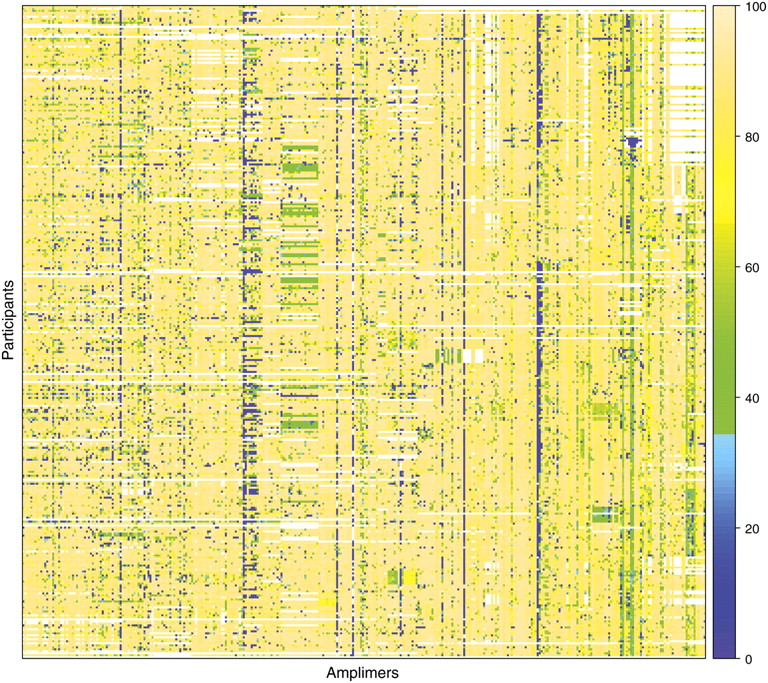
Snapshot of ClinSeq sequence coverage. This “heat map” provides an overview of the targeted sequence coverage for 27 genes selected at random from the set of 140 genes with completed PCR primer design. The figure illustrates the range and variability in the yield of sequence data for a subset of the analyzed genes. These 27 genes are being sequenced using 343 amplimers (of 2444 total) represented by columns; the data are shown for 326 enrolled participants (of 586 total) represented by rows. The colors represent the percent sequence coverage (see scale on right) of the corresponding PCR products at or above a threshold of phred Q20, with white indicating the absence of data at this time. Such heat-map results are used to monitor overall quality of the ClinSeq sequencing pipeline, whereas more direct quality measures (see text) are used to assess the suitability of individual sequence data for inclusion in subsequent analyses and/or return to participants. The complete heat map showing all amplimers and all participants for the data set discussed here is provided in Supplemental Figure S1.


