
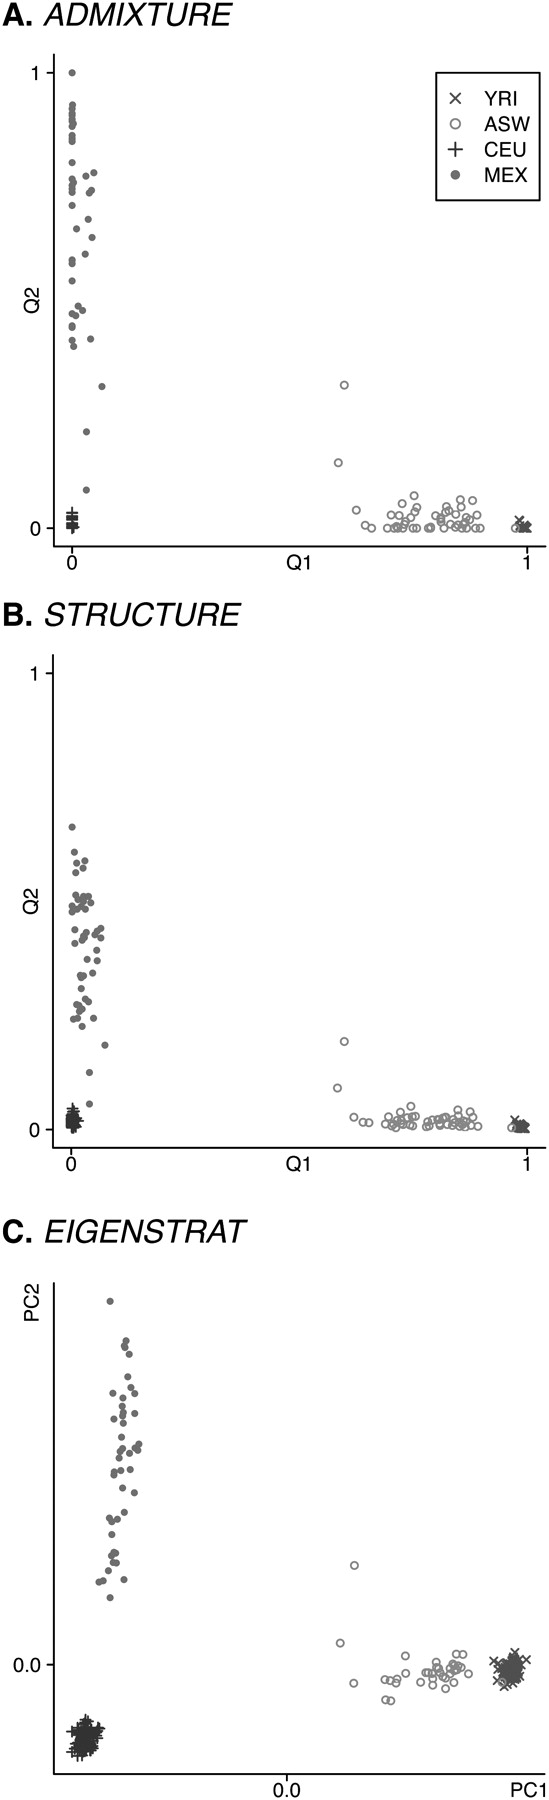
Figure 1.
Analyses of the HapMap3 data set. K = 3 for ADMIXTURE and structure. Plotted for each individual i are the point  for ADMIXTURE (A) and structure (B), and the point (PC1i, PC2i) for EIGENSTRAT (C). Self-reported ancestries are indicated: (×) YRI; (○) ASW; (+) CEU; (●) MEX.


