
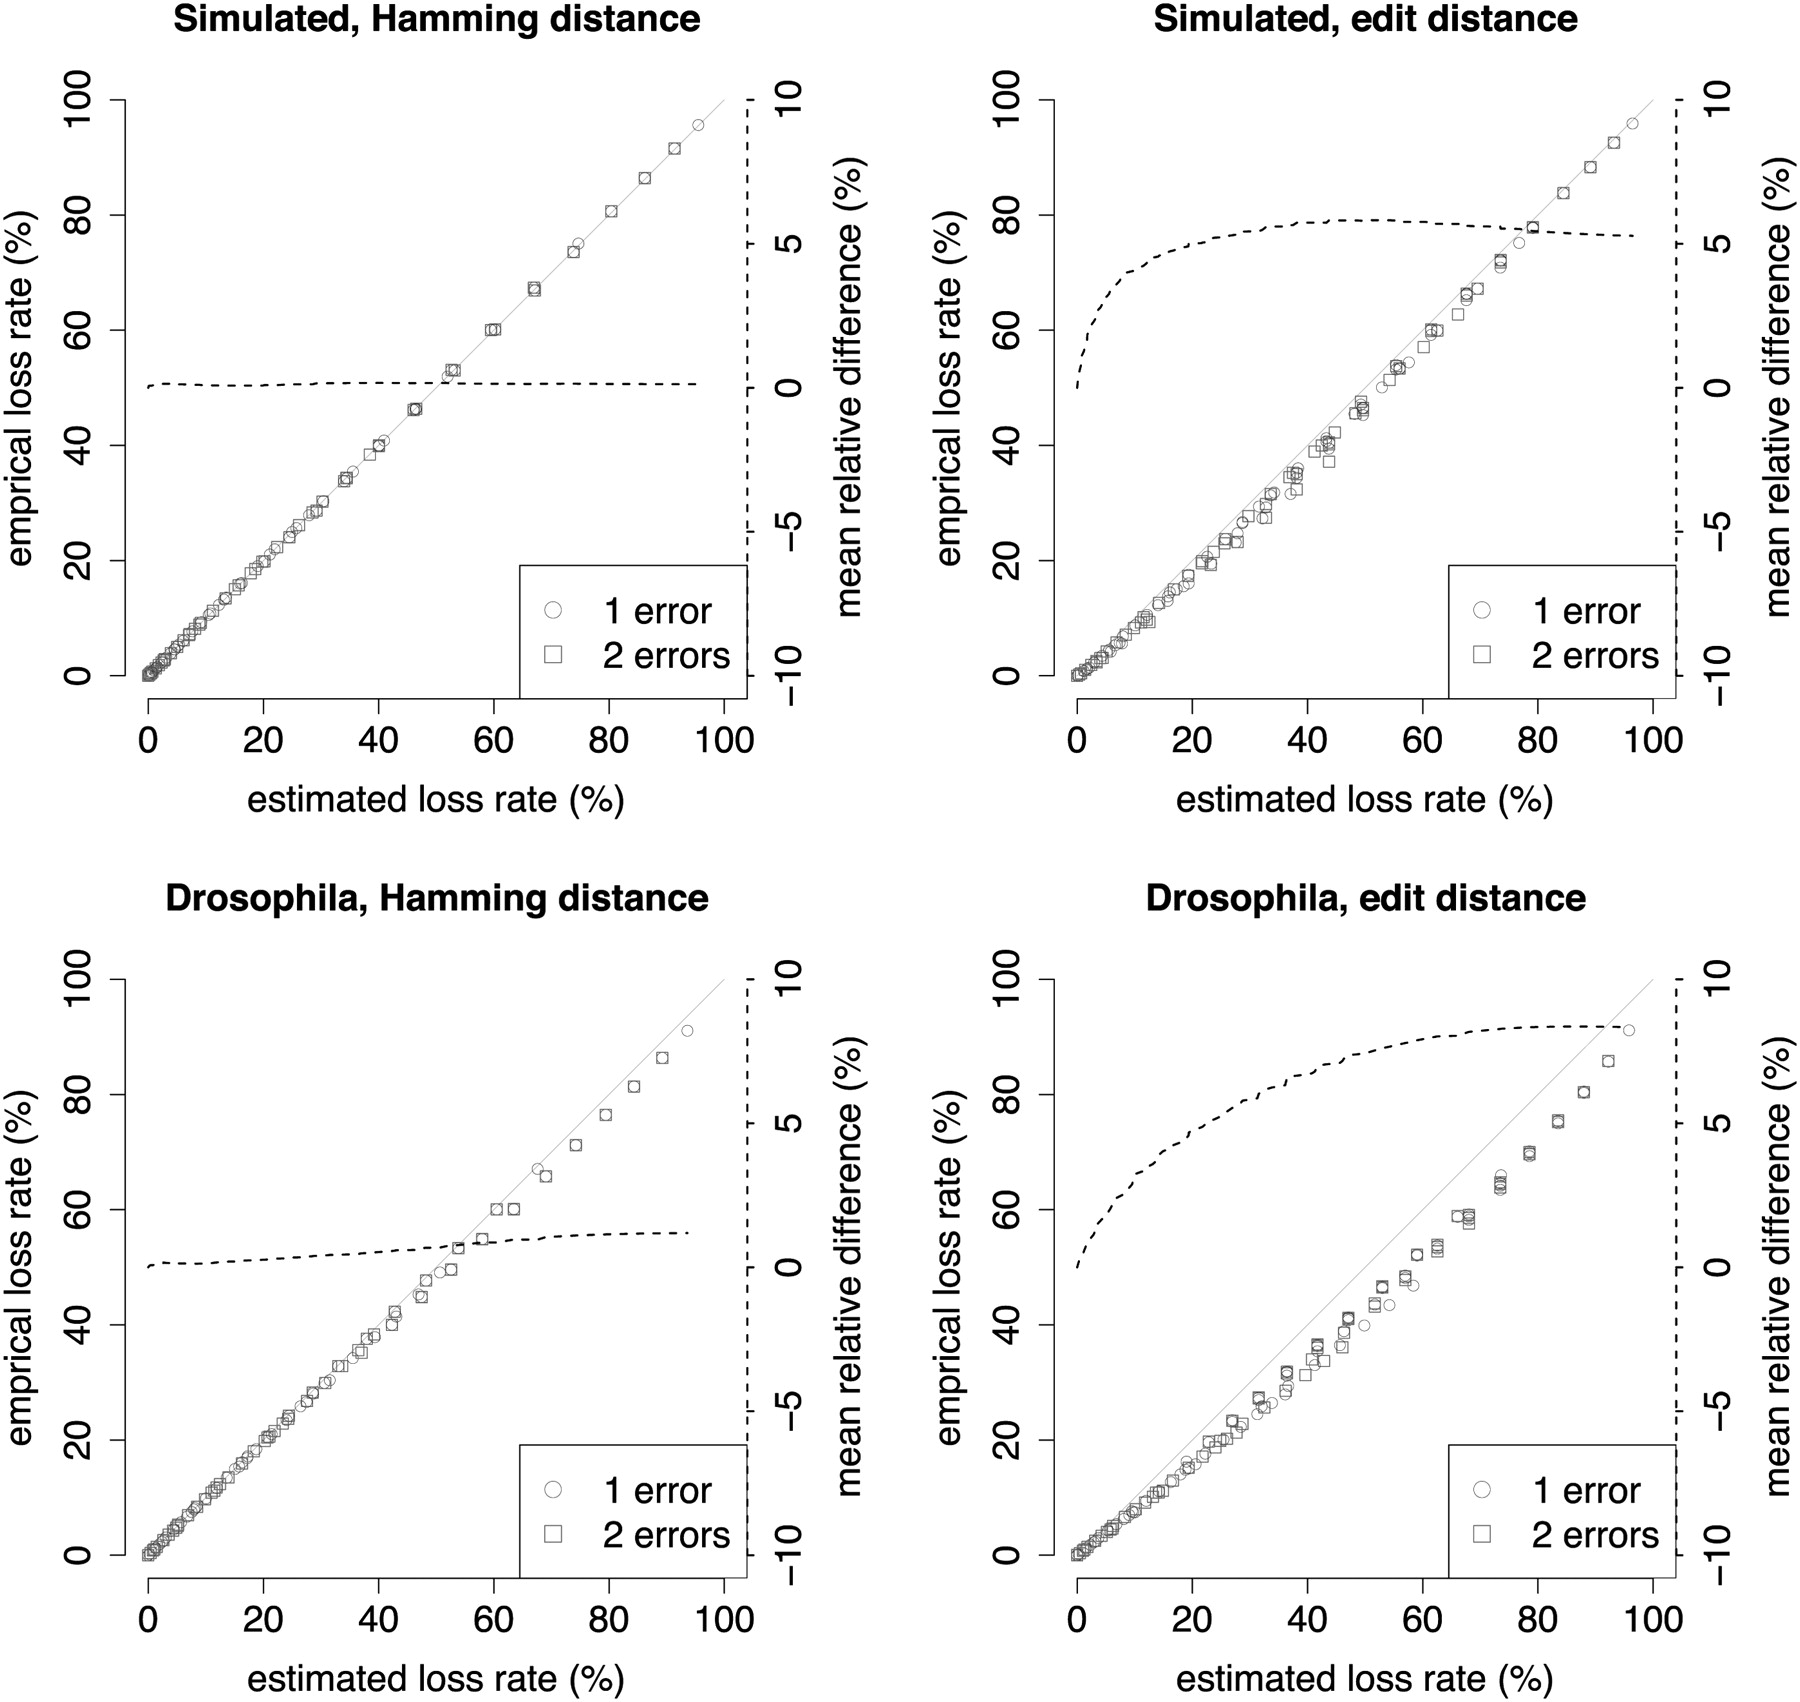
Figure 3.
Comparison of estimated and empirical loss rates (loss rate = 1 − sensitivity) varying weight q = 8,…, 14 and threshold t = 1,…, 20. The dashed line reflects the mean of relative differences, 1 − (empirical loss rate/estimated loss rate), of all estimated loss rates below a varying level.


